|

Understanding through Discussion |
|
|
Register | Sign In |
|
QuickSearch
| EvC Forum active members: 66 (9164 total) |
|
| |
| ChatGPT | |
| Total: 916,483 Year: 3,740/9,624 Month: 611/974 Week: 224/276 Day: 64/34 Hour: 1/2 |
| Thread ▼ Details |
|
Thread Info
|
|
|
| Author | Topic: evolutionary chain | ||||||||||||||||||||||||||||
|
crashfrog Member (Idle past 1489 days)  Posts: 19762 From: Silver Spring, MD Joined: |
Hey crash, I think hes refering to the bit about geneologies in the bible. They're just an illustrative example about how decendance does, or doesn't, work. What, we can't use analogies now?
|
||||||||||||||||||||||||||||
today9823  Inactive Member |
take my sight... this is something new arriving in my mother... although I have the ability to see talk and think I am a creator and I figure we are kinda like cell although we are bigger and more indipendant
Love RIchard
|
||||||||||||||||||||||||||||
|
today9823 Inactive Member |
we can think... we can create something within our creation power... and then take a look at our eyes... a creation from a master
|
||||||||||||||||||||||||||||
|
Lithodid-Man Member (Idle past 2953 days)  Posts: 504 From: Juneau, Alaska, USA Joined: |
What happened???!! I thought you would suspend this moron. I would recomend complete deletion.
|
||||||||||||||||||||||||||||
|
AdminNWR Inactive Member |
I have removed your posting privileges, today9823. In spite of earlier warnings, you have continued to preach, rather than engage in on-topic discussion.
If you want your privileges restored, you will need to request that via email to one of the site administrators. This message has been edited by AdminNWR, 11-06-2005 06:40 AM
|
||||||||||||||||||||||||||||
|
AdminNWR Inactive Member |
...suspend this moron
Please avoid disrespectful language when referring to other members. See the site rules. Added in edit: Please stay on topic in threads. Comments on moderation should be made in General discussion of moderation procedures: The Consecution. This message has been edited by AdminNWR, 11-06-2005 06:56 AM
|
||||||||||||||||||||||||||||
|
mick Member (Idle past 5008 days)  Posts: 913 Joined: |
Hi minnemooseus,
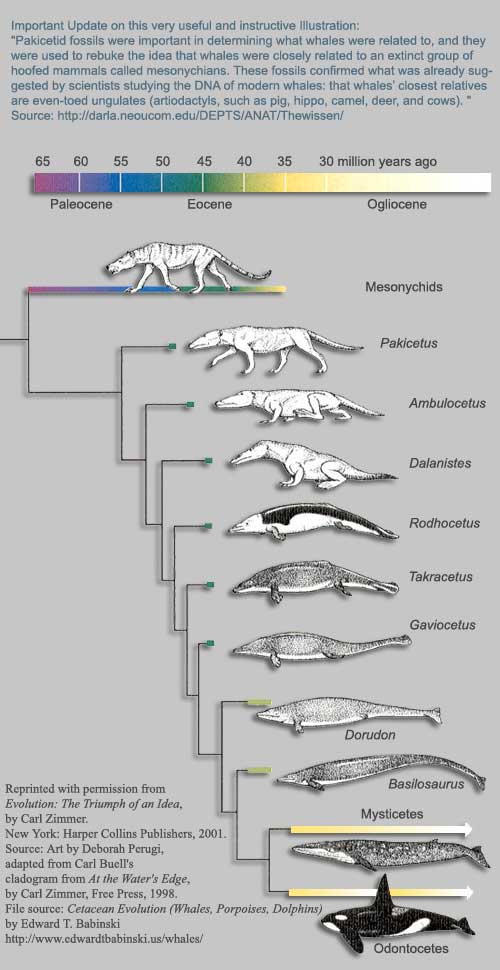
minnemooseus writes: The diagram had me a bit confused at first - I guess I was looking at it geologically, with the progression being bottom (oldest) to top (youngest). I just want to clarifiy that the progression is from upper left to lower right. There are lots of ways you could look at that tree. It's a horizontal tree, so the basic idea is that branching points to the left are older than branching points to the right (so read it left to right, don't worry about top to bottom). The top to bottom order doesn't actually matter. For example here are two trees which have identical topology. You are wrong if you think that the first tree tells you that aardvarks and mice are closely related, while the second tree tells you that chimps and elephants are closely related. The only thing that matters in a tree drawn like this is the horizontal position of branch points. The genealogical relationships implied by these two trees are identical.
minnemooseus writes: Would it be accurate to say that the various line junctions would represent the proverbial "missing links" (no chain pun intended)? A common ancestor to the species that came later? The branching points, or as you call them "line junctions", represent changes in traits. The tree was generated by examining a whole bunch of traits (bone shape, DNA sequence, whatever) and trying to find the most parsimonious tree that relates those traits (in practise, it is often the tree that requires the fewest trait changes). Each time a branch splits into two, it represents a change in one of the traits that was used to generate the tree. Those branching points DO NOT REPRESENT SPECIATION EVENTS. They just represent changes in the traits used to generate the cladogram. (I should say that this mistake is made by many biologists as well as intelligent laypersons). For example let's say we sequence a rapidly-evolving gene or microsatellite or someting on the Y chromose of my immediate family. It's on the Y chromosome, so it's only found in males. We go round the homes of my male relatives and get a tissue sample. We sequence the gene and generate a phylogeny that looks something like this:
The branching points DO NOT represent missing ancestors! They DO NOT represent missing links! They represent mutation events in the gene on the Y-chromosome that are of phylogenetic significance. Hope this helps! Mick First edit: made my family phylogeny more straightforwardSecond edit: I just wanted to make it clear, there is no "missing link" between me and my father. Look at the cladogram above, and you will understand that the branch point does not represent any missing data. A tree is just a way of representing a hereditary trait. Trees don't contain less data than chains. This message has been edited by mick, 11-06-2005 06:52 PM This message has been edited by mick, 11-06-2005 07:00 PM
|
||||||||||||||||||||||||||||
|
NosyNed Member  Posts: 9003 From: Canada Joined: |
I thought I understood what those diagrams meant. If I had been asked the details there is a good chance I would have gotten it wrong.
That was very helpful.
|
||||||||||||||||||||||||||||
|
mick Member (Idle past 5008 days) Posts: 913 Joined: |
Hi Lithodid-Man,
lithodid writes: I really like your example, I would love a good ref for your picture. I think it answers many creo arguments. Here's a version of the picture which includes a reference (I should have given the reference originally, sorry). I hope it is useful.
lithodid writes: As an aside, I like your avatar and was wondering where it came from. It is Pandalus platyceros, P. borealis, P. hypsinotus, another P. borealis, and P. goniurus. Definatley an E Pacific group.
Ah... that's a problem. I copied it from an academic website while browsing but have no idea where it came from. I liked it because of the clear evolutionary process, the colours, and because it makes me think of olive oil and lots of garlic.... I assume the photographers won't mind too much.
lithodid writes: I am a caridean shrimp biologist in Alaska Were you at the SSE meetings last year in Fairbanks? I say I am from the UK on my account here, but I'm currently based in Vancouver BC. I was there, probably missed your talk... Cheers Mick
|
||||||||||||||||||||||||||||
|
RAZD Member (Idle past 1427 days)  Posts: 20714 From: the other end of the sidewalk Joined: |
Presumably this is from the randman files ...
 It would be interesting to me to see some kind of representation of the fossil record to go with the graphic and show some drift from one to another in the process. Not sure how you could tie it together coherently though. You can get an idea of what I mean fromhttp://www.mnh.si.edu/anthro/humanorigins/ha/a_tree.html Although the linked information is not related strictly to the fossil record density. by our ability to understand RebelAAmerican.Zen[Deist
... to learn ... to think ... to live ... to laugh ... to share.
|
||||||||||||||||||||||||||||
|
RAZD Member (Idle past 1427 days) Posts: 20714 From: the other end of the sidewalk Joined: |
here is another example of what I mean
A Smooth Fossil Transition: Pelycodus You get a feeling for the number of fossils within the tree structure and the diversity at each level before and after the split. This one strikes me as a general trend to larger and larger size for the main population from P. ralstoni through P. jarrovii and on to N. venticolus with a branching speciation event at P. jarrovii to N. nunienus that reverts rapidly in size to the P. ralstoni range.
When two similar species compete, it is not uncommon that one fairly quickly becomes different - in this case, smaller. This presumably reduces the competition between the species. This would also indicate to me that the original habitat was gradually abandoned by the larger and larger versions in favor of other {food\niche\behavior} - perhaps more time on the ground and less in the upper branches - until there was sufficient opportunity for a smaller version to take advantage of the old one with pre-adapted abilities. by our ability to understand RebelAAmerican.Zen[Deist
... to learn ... to think ... to live ... to laugh ... to share.
|
||||||||||||||||||||||||||||
|
mick Member (Idle past 5008 days) Posts: 913 Joined: |
Yeah, that's fantastic. I haven't seen anything similar for whales but I bet it's possible to build one using the computerised catalogues of each museum's fossil collection. For example, Berekely has a database (searchable by class, order, family, genus, species) at http://elib.cs.berkeley.edu/ucmp/advanced.shtml which contains over 250,000 fossils, and over 1000 cetacean fossils. I'm sure if one searched the catalogues of each major museum in north america one could easily(?) create a similar graphic showing the transition for cetaceans (and many other groups). Mick
|
||||||||||||||||||||||||||||
|
Christian Member (Idle past 6278 days)  Posts: 157 Joined: |
There's so much in this thread now, it's hard to find the chains I've been given. You gave me a list, but I clicked on all of those and got nothing. Maybe you could list the chains you want me to take a look at and I'll do that.
|
||||||||||||||||||||||||||||
|
Christian Member (Idle past 6278 days) Posts: 157 Joined: |
It's difficult to know where to start since it's been awhile since I've posted on this topic and so much has been said. I still haven't read everything that's been said. So if I ask questions which have already been answered please bear with me.
To anyone I haven't responded to: Please understand that this is because of a lack of time and not because of any desire to avoid anything. That said, I'll jump in.
Again, you are asking for something from fantasy land.
I think you misunderstood me. There have been studies done to try to determine just how complete or incomplete the fossil record is. I thought I'd ask for the information rather than provide it so people wouldn't attack my source. Here's a quote from Michael Denton's book Evolution: a theory in crisis
Maybe you can tell me what percentage of people living today are decendants of people that have been recorded in history. G.G.Simpson recently estimated the percentage of living species recovered as fossils in one region of North America and concluded that, at least for larger terrestrial forms, the record may be almost complete!(Simpson, op cit, Table 8) Here's a Table compiled from Romer (whatever that is):
#of living orders of terrestrial vertebrates.......43 # of living orders of terrestrial vertebrates found as fossils.....42 percentage fossilized..............................97.7% # of living families of terrestrial vertebrates..............329# of living families of terrestrial vertebrates found as fossils..261 percentage fossilized...........................79.1% # of living families of terrestrial vertebrates excluding birds...........178# of living families of terrestrial vertebrates found as fossils excluding birds .........156 percentage fossilized............87.8%(Romer,op cit,compiled from information on pp 347-96)
|
||||||||||||||||||||||||||||
|
RAZD Member (Idle past 1427 days) Posts: 20714 From: the other end of the sidewalk Joined: |
I think it is better than thinking of images in chains and branches because it reflects the actual information better while still showing the overall trends
and the divergences are more easiliy seen as a parting of the ways of individuals rather than one individual type becoming two types - a herd of animals divided in a stampede through time into separate paths by our ability to understand RebelAAmerican.Zen[Deist
... to learn ... to think ... to live ... to laugh ... to share.
|
||||||||||||||||||||||||||||
|
|
Do Nothing Button
Copyright 2001-2023 by EvC Forum, All Rights Reserved
![]() ™ Version 4.2
™ Version 4.2
Innovative software from Qwixotic © 2024