|

Understanding through Discussion |
|
|
Register | Sign In |
|
QuickSearch
| Thread ▼ Details |
|
Thread Info
|
|
|
| Author | Topic: Tired Light | |||||||||||||||||||||||||
|
Percy Member  Posts: 22508 From: New Hampshire Joined: Member Rating: 5.4 |
peaceharris writes: In message 267, I wrote:
I would truly appreciate if someone could show me a spectrum where Hydrogen lines have been redshifted by z>1.
Notice that I used the plural 'lines' It is easy to make a claim for a single Hydrogen line. This Lyman alpha line isn't backed up other redshifted Hydrogen lines. These graphs from Eta from the paperHigh-Redshift Quasars Found in Sloan Digital Sky Survey Commissioning Data. V. Hobby-Eberly Telescope Observations can't be interpreted by the uninitiated, e.g.:
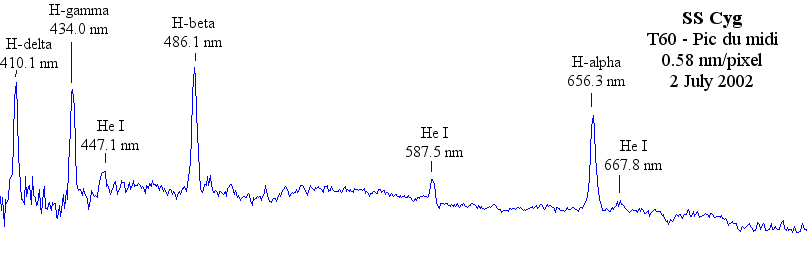
I've just initiated myself with a short visit to Hyperphysics on Hydrogen and UCLA Cosmology Tutorial. Naturally, recent initiates are prone to error, so I'd appreciate any corrections. There are two spikes on each graph. Some simple calculations reveal that the line nearest to 6000 angstroms is the Lyman alpha line of 1220 angstroms red-shifted up to around 6000 angstroms. I don't know what the other spike is. The jaggedness of the graphs is caused by absorption at various red-shifts of intervening clouds. The lines shown on the graphs are limited by the bandwidth of the spectrograph used by the researchers, which they say has a range from 5000-10,000 angstroms. They Lyman alpha line is the only hydrogen line that fits within this spectrum for these z values around 3.8, so this particular study didn't have the capability to measure other hydrogen lines. For example, the lowest Balmer series line at 4102 angstroms would be red-shifted up to around 19,700 angstroms for z=3.8, way out of the range of this device. But this spectrograph could easily examine the Balmer lines by looking at objects with lower red shifts. The longest Balmer line at 6563 angstroms would be viewable by this device for any object within our galaxy, and within all nearby galaxies, where z is approximately 0. The next shorter Balmer line at 4861 angstroms would be viewable by this device for objects with z between .1 and .8. The Balmer line after that at 4341 angstroms would be viewable with z between .2 and 1. The shortest Balmer line at 4102 angstroms would be viewable with z between .3 and 1.2. It would be relatively easy to find large numbers of objects with such low z values, so it should be possible for this spectrograph to display all four Balmer lines on a single graph. Unless absorption by the interstellar medium is a problem at these wavelengths, I imagine this has already been done many times. I'm no astromer so I wouldn't know if this measurement has been done or not, but poking about on the web I found this spectra showing all the Balmer lines at Vspec - Line measurement:
Is that what you were looking for? --Percy This message has been edited by Percy, 04-12-2005 08:44 PM
|
|||||||||||||||||||||||||
|
Eta_Carinae Member (Idle past 4405 days)  Posts: 547 From: US Joined: |
that is the spectrum of a cataclysmic variable SS Cygni. He wants high redshift showing more than one H line.
|
|||||||||||||||||||||||||
|
Eta_Carinae Member (Idle past 4405 days) Posts: 547 From: US Joined: |
It's not a case of making the claim for a single line. The C and N lines present are just as valid as other Hydrogen lines.
I am coming to the conclusion that you are being idiotic!
|
|||||||||||||||||||||||||
|
Eta_Carinae Member (Idle past 4405 days) Posts: 547 From: US Joined: |
showing Ly Alpah & Lyman Beta & the Lyman limit.
Page not found | American Institute of Physics
|
|||||||||||||||||||||||||
|
Eta_Carinae Member (Idle past 4405 days) Posts: 547 From: US Joined: |
http://adsabs.harvard.edu/cgi-bin/...
{Shortened display form of URL, to restore page width to normal. - Adminnemooseus} This message has been edited by Adminnemooseus, 04-11-2005 02:51 PM
|
|||||||||||||||||||||||||
|
Eta_Carinae Member (Idle past 4405 days) Posts: 547 From: US Joined: |
Spitzer
Do you know why you don't see the Balmer series lines in emission from high redshift objects???? See peaceharris, you are thinking you've stumbled upon something when in reality all you have done is found the huge holes in your knowledge.
|
|||||||||||||||||||||||||
|
Percy Member Posts: 22508 From: New Hampshire Joined: Member Rating: 5.4 |
I'm finding this stuff hard to interpret. Can you put it all in context for the rest of us?
--Percy
|
|||||||||||||||||||||||||
|
Admin Director  Posts: 13046 From: EvC Forum Joined: Member Rating: 2.7 |
At EvC Forum we've evolved the tradition where those who know the most and are the most articulate are held to the highest standards. Psychological studies have shown that overconfidence and arrogance go hand in hand with lack of knowledge and skills. The most common offenders in this category are teenage boys. There's no need for those with the most knowledge and skills to display behavior consistent with this group.
If you know it, just tell it. Leave out the personal asides. For example, that Lyndon Ashmore didn't know it was made clear less by his inability to tell it than by his perpetual personal asides. By the way, AdminJar noticed that Lyndon had joined even before he made his first post, and he commented to me that Lyndon was known for charging in to a discussion board full bore and then gradually fading away, which is precisely what happened here. From the perspective of judging and assessing a debate, not from any Forum Guidelines standpoint, Lyndon lost the debate because not only was what he was saying shown to be wrong, the longer the debate went on the more simple his errors became, such as near the end when he applied the behavior of electrons in a wire to his space plasma.
|
|||||||||||||||||||||||||
|
peaceharris Member (Idle past 5627 days)  Posts: 128 Joined: |
Percy writes: There are two spikes on each graph. Some simple calculations reveal that the line nearest to 6000 angstroms is the Lyman alpha line of 1220 angstroms red-shifted up to around 6000 angstroms. I don't know what those 2 spikes are. There are many Balmer lines, Na lines, He lines, etc... which are closer than the Lyman alpha line. The link to Vspec - Line measurement provides clear unambiguous non redshifted Balmer lines. I am looking for data like this for redshifts with z>1.
Percy writes: The lines shown on the graphs are limited by the bandwidth of the spectrograph used by the researchers, which they say has a range from 5000-10,000 angstroms. What prevents them from using different spectrographs to show that the Hydrogen lines are consistently redshifted by the same amount?
Eta writes: showing Ly Alpah & Lyman Beta & the Lyman limit.Page not found | American Institute of Physics Fantasies.
Eta writes: Do you know why you don't see the Balmer series lines in emission from high redshift objects???? Either because no one has shown this data to me, or because it doesn't exist.
|
|||||||||||||||||||||||||
|
Eta_Carinae Member (Idle past 4405 days) Posts: 547 From: US Joined: |
you have a view so ingrained that it isn't allowing you to look at the data.
I show you the Lyman series and you say fantasy. I also provided a link showing the Balmer lines at slightly lower redshifts of 1.5 or so. I also linked a Spitzer observation of the Paschen lines in a high redshift object. Here are some Balmer series lines with Spitzer observations of some low-medium redshift objects. http://arxiv.org/PS_cache/astro-ph/pdf/0411/0411416.pdf The only fantasy involved here is you thinking you are interpretings correctly. Here I'll help you out - the reason you don't see Balmer lines for high redshift objects is because they are shifted into regions that we cannot observe die to the atmosphere not allowing it through. The IR region has only limited windows for observation. That is why for high redshift objects you see the Lyman series used and the CIV and CIII lines and Mg lines used. At lower redshifts, which I also linked to, you do see the Balmer lines used since they are still observable. DO NOTE HOWEVER, that often in Quasars the Balmer lines can be quite weak because of absorption effects and ionisation conditions which is another reason the Lyman lines are often preferable. Now that Spitzer is on line you will see the Balmer lines used. In fact I showed you a link using the Paschen series. What do you think the odds are that all these lines from various elements happpen to line up in tens of thousands of spectra if somehow we all have it wrong? This message has been edited by Eta_Carinae, 04-11-2005 10:13 PM
|
|||||||||||||||||||||||||
|
peaceharris Member (Idle past 5627 days) Posts: 128 Joined: |
Eta writes: What do you think the odds are that all these lines from various elements happpen to line up in tens of thousands of spectra if somehow we all have it wrong? Very high probability. Since you have got many free parameters to play with: 1) You can choose Z2) You can choose which element it is. (Each element has many lines) 3) You can imagine lines existing when there are none. Eta's imagination of the redshifted Lyman beta line: Quote from message 274
showing Ly Alpah & Lyman Beta & the Lyman limit. Page not found | American Institute of Physics This message has been edited by peaceharris, 04-12-2005 12:14 AM
|
|||||||||||||||||||||||||
|
Sylas Member (Idle past 5291 days)  Posts: 766 From: Newcastle, Australia Joined: |
peaceharris writes: Very high probability. Since you have got many free parameters to play with: This is false. If it was true, we would not be able to measure any redshifts at all. But of course we can recognize shifted patterns, and use z as a measure of how far they have shifted.
|
|||||||||||||||||||||||||
|
peaceharris Member (Idle past 5627 days) Posts: 128 Joined: |
In AJ Vol 121 pg 1232, the authors claim that there is Lyman alpha emission. Note that their spectrographs start with ~5200A. They also claim that some of their data are with Z>4. This would imply that in addition to the Lyman alpha line, we would be able to see the Lyman beta line in some of these spectra.
Why is the claimed Lyman alpha emission so strong, but Lyman beta (if there) looks like noise?
|
|||||||||||||||||||||||||
|
Eta_Carinae Member (Idle past 4405 days) Posts: 547 From: US Joined: |
Huh?
At a z of 4 the Lyman Beta line is at 5125 Angstroms which is right at the edge of the plot for the 2 or 3 examples they have at zof about 4. You can see it rising up right at the edge or just in from the edge. Are you blind? These peaks are matched by fitting template spectra from lower redshift data and even though the peaks are sometimes embedded in the noise they can be statistically picked out. But in these examples you can pick them out by eye anyway. I also provided another link where the Beta line is really obvious. The reason the Beta line is often much weaker is because of intervening absorption by hydrogen along the line of sight.
|
|||||||||||||||||||||||||
|
Eta_Carinae Member (Idle past 4405 days) Posts: 547 From: US Joined: |
Absolute complete and utter hogwash.
You have almost no free parameters to twiddle. I agree this is the case with the supposed z=9 objects where you have one line that has been interpreted as Lyman Alpha. But in all these cases you have many lines from several elements all lining up and statistically matched and correlated with template spectra. The odds of this giving a wrong redshift are bascally zero. You cannot choose which element it is. If someone was saying that such and such line was a line due to Technetium of Hafnium then I'd agree that would be contrived since these elements are very very rare but when you have all the common elements seen in low redshift AGN and the same order and relative strength of lines and continuum indices lie up and correlate then you have a cast iron redshift. NO you cannot imagine lines existing when there are none. These are statistically matched using templates. If the lines were imaginary they would be rejected. You haven't a clue!!!!!! This is not some guy on his own doing this by eye - even though this could be done for many of these spectra - it's done by a sophisticated correlation analysis often with a dozen or two lines.
|
|||||||||||||||||||||||||
|
|
Do Nothing Button
Copyright 2001-2023 by EvC Forum, All Rights Reserved
![]() ™ Version 4.2
™ Version 4.2
Innovative software from Qwixotic © 2024