|

Understanding through Discussion |
|
|
Register | Sign In |
|
QuickSearch
| Thread ▼ Details |
|
Thread Info
|
|
|
| Author | Topic: Earth science curriculum tailored to fit wavering fundamentalists | ||||||||||||||||||||||||||||||||||||||||
|
RAZD Member (Idle past 1436 days)  Posts: 20714 From: the other end of the sidewalk Joined: |
kbertsche mentions sn1987a. There are several threads on this forum that discuss this supernova event, and it is a special case ideal for your questions: this star exploded twice -- the first time it threw off a layer of gas that expanded away from the star, the second was the nova event. What is measured is the light from the nova striking the shell of gas from the previous explosion by the time delay in seeing light from the nova star directly and then the light from the interaction with the shell. This star is also close enough so that the subtended angle can be measured, and this defines a triangle by simple geometry. Thus you can calculate the actual distance.
So not only the Nova would need to be faked, but the previous explosion that formed the outer shell. A similar distance measurement is Eye of Sauron - the ring to "rule" them all ... distance 19 megaparsecs If we assume that god/s don't lie or lay traps (no jokers) then we can assume that evidence represents reality, and that last assumption is all we need to do science. Enjoy Edited by RAZD, : .by our ability to understand Rebel☮American☆Zen☯Deist ... to learn ... to think ... to live ... to laugh ... to share. Join the effort to solve medical problems, AIDS/HIV, Cancer and more with Team EvC! (click)
|
||||||||||||||||||||||||||||||||||||||||
|
RAZD Member (Idle past 1436 days) Posts: 20714 From: the other end of the sidewalk Joined: |
In addition, SN1987a helps address other YEC questions such as 'How do we know that the speed of light has been constant over time?' and 'Isn't it just an assumption that decay rates are constants'. We get a data point on those issues 170,000 years ago. Indeed, you can watch Cobalt decay just as it does on earth. As I recall there was discussion of this on at least one thread here. Message 72 shows how we know the distance, and Message 109 discusses why we know the speed of light AND the radioactive decay rates have been constant for 170,000 years. Another indication that decay rates have been constant for a goodly while are Uranium haloes
Are Uranium Halos the best evidence of (a) an old earth AND (b) constant physics? Enjoyby our ability to understand Rebel☮American☆Zen☯Deist ... to learn ... to think ... to live ... to laugh ... to share. Join the effort to solve medical problems, AIDS/HIV, Cancer and more with Team EvC! (click)
|
||||||||||||||||||||||||||||||||||||||||
|
RAZD Member (Idle past 1436 days) Posts: 20714 From: the other end of the sidewalk Joined:
|
As a general comment to all the wonderful contributors to this thread, know that I am very busy studying the links and topics that you have suggested. I spending often 6-8 hours a day on the topic. And I'm enjoying the hell out of it. A lot to learn. You are now hopelessly hooked on EvC. I look forward to your 1,000th post ... There is no cure  by our ability to understand Rebel☮American☆Zen☯Deist ... to learn ... to think ... to live ... to laugh ... to share. Join the effort to solve medical problems, AIDS/HIV, Cancer and more with Team EvC! (click)
|
||||||||||||||||||||||||||||||||||||||||
|
RAZD Member (Idle past 1436 days) Posts: 20714 From: the other end of the sidewalk Joined: |
These are two topics you can introduce without challenging theistic beliefs.
From Atheists can't hold office in the USA?, Message 618 quote: Good resources for logical fallacies are:http://onegoodmove.org/fallacy/toc.htm Formal fallacy - Wikipedia Page not found - Nizkor Logically Fallacious - Webpages Other peeps may have other references.
quote: Logic and skepticism are natural and necessary parts of science, as is the intellectual caution due to the tentativity of knowledge. Enjoyby our ability to understand Rebel☮American☆Zen☯Deist ... to learn ... to think ... to live ... to laugh ... to share. Join the effort to solve medical problems, AIDS/HIV, Cancer and more with Team EvC! (click)
|
||||||||||||||||||||||||||||||||||||||||
|
RAZD Member (Idle past 1436 days) Posts: 20714 From: the other end of the sidewalk Joined:
|
There have been a few threads discussing what this entails (I referred to one, Is My Hypothesis Valid???, that involves the starting process - developing an hypothesis).
Heres a flow chart I put together for another thread:
As you can see the process is never ending, whether the test result is positive or negative you go back and make either a new hypothesis or a new prediction to test, pausing only to report on results. This particular image is public access, free to be copied and used. Enjoyby our ability to understand Rebel☮American☆Zen☯Deist ... to learn ... to think ... to live ... to laugh ... to share. Join the effort to solve medical problems, AIDS/HIV, Cancer and more with Team EvC! (click)
|
||||||||||||||||||||||||||||||||||||||||
|
RAZD Member (Idle past 1436 days) Posts: 20714 From: the other end of the sidewalk Joined: |
I presume that you're looking at dates with the initials BP after them. BP stands for "before present". So year 0 is, in fact, now, and then larger number are years further into the past. Actually BP is defined as 1950 ce -- basically the time when atomic bomb testing started really messing up the 14C/12C ratios in the atmosphere. It is useful to use a single timeline with all dates measured directly from that point backwards as it avoids the slight error cause by not having a zero year ce/bce (the year before 1 ce is 1 bce). CE/BCE refer to "common Era" and is the secular version of AD/BC. Enjoyby our ability to understand Rebel☮American☆Zen☯Deist ... to learn ... to think ... to live ... to laugh ... to share. Join the effort to solve medical problems, AIDS/HIV, Cancer and more with Team EvC! (click)
|
||||||||||||||||||||||||||||||||||||||||
|
RAZD Member (Idle past 1436 days) Posts: 20714 From: the other end of the sidewalk Joined: |
One thing I'm a bit confused about is the sources seem almost evenly split between describing the ratio between C14 and C12 as part of the measurement process and saying nothing about ratio and merely talking about measuring the C14. I'm trying to figure out ifA: the ratio is relevant B: if relevant, how is the ratio used. Consider that the amount of 12C is dependent on the size of the sample and the density of the carbon in the sample, so the same would apply to undecayed 14C (organic take-up of carbon is non-selective of isotopes), so to remove this variable from the testing the amount of 14C is compared to the amount of 12C.
So in the above example (green background portion) it clearly talks about comparing the *ratio of carbon-14 to carbon-12* in the sample to the *ratio* in the living organism and using that to date. But yet when I look at the formula provided, I don't see any utilized ratio, only the %C14 is input to the formula. What am I missing? As this site was designed for kids to be able to understand (the whole "howstuffworks" site is great in that regard), it is a little simplified. That formula is the standard radioactive decay formula that can be used for any radioactive isotope. As noted we can use %14C/12C and the formula works. Think of it this way ...
t = [ ln (Nf/No) / (-0.693) ] x t1/2 Nf = (14C/12C)fNo =(14C/12C)o So
(14C/12C)f (14C/12C)o Becomes
(14C)f/( (14C)o/( Becomes
(14C)f (14C)o There are a couple of squirrely aspects to 14C dating, this is one (and it could be an interesting exercise to run through how you do end up with Nf/No with the kids) -- another is that the modern measured decay half life is not used in dating, rather the original half-life estimated by Libby is used. This is so new dates of artifacts can be compared to old ones without confusion with which rate was used, and because they are then corrected with the calibration curve (that uses the old rate) and they want to avoid making a correction twice. The method (another good site)
quote: bold added Radiocarbon Date calculation
quote: bold added Modern measurements put the half-life at 5730 years. This is not a problem as long as both calculated dates are calibration curves use the same half-life of 5568. Another way to think about it is that the calculated 14C date is actually a measurement of the percentage of 14C compared to 12C in the sample, which is then correlated with tree ring 14C/12C percentages to give an approximated age. Enjoy Edited by RAZD, : clrtyby our ability to understand Rebel☮American☆Zen☯Deist ... to learn ... to think ... to live ... to laugh ... to share. Join the effort to solve medical problems, AIDS/HIV, Cancer and more with Team EvC! (click)
|
||||||||||||||||||||||||||||||||||||||||
|
RAZD Member (Idle past 1436 days) Posts: 20714 From: the other end of the sidewalk Joined: |
And yeah I've read about the updated half life numbers. I assume that IntCal takes the updated half life into account? In other words, using IntCal13 you can take a C14 date, cross reference it and no other calibrations are required? No, they still use the OLD half-life for the correlation curves. This is so any sample, old or new can be compared on the correlation curve to get a calibrated date. Like I said, squirely). What you actually have with a 14C date is a measure of 14C/12C plotted on a log scale and the "14C dates" can be converted back to 14C/12C numbers, at which point the half-life is irrelevant to the correlation and the calibrated date. Here is an example of this approach that I believe I posted this before:
Christian Geologists on Noah's Flood: Biblical and Scientific Shortcomings of Flood Geology, part 4 quote: Does that help? Enjoyby our ability to understand Rebel☮American☆Zen☯Deist ... to learn ... to think ... to live ... to laugh ... to share. Join the effort to solve medical problems, AIDS/HIV, Cancer and more with Team EvC! (click)
|
||||||||||||||||||||||||||||||||||||||||
|
RAZD Member (Idle past 1436 days) Posts: 20714 From: the other end of the sidewalk Joined: |
Ok, so in addition to IntCal13, there is an ~1.03 (5730/5568) correction that still must be made. Actually no, unless what you want is a slightly more accurate calculated 14C date. When you use the calibration curve it corrects for (a) the variation in atmospheric 14C at the time the ring (sample) formed due to cosmogenic variations, and (b) the difference from raw 14C date (with old half-life) to actual tree ring date. Correcting the raw date to 5730 from 5568 and then entering the calibration curve would mean you have corrected it twice.
Message 117: Yeah, I get it. The truth of all this is that for YEC purposes, one doesn't have to do any calibration corrections at all. More to the point, when the corrections are made the artifact dates become older. That's the thing I want to make clear to the kids. All this talk on the YEC sites about equilibrium assumptions killing RC dating are BS in at least 2 ways: 1: scientists DON'T assume equilibrium in atmospheric C14. Correct. An old YEC argument I remember was that 14C is unreliable because not enough time has passed for 14C to reach an equilibrium level (which has to do with chain decay in other radiometric isotopes).
2: even if they did it wouldn't freaking matter to the YEC argument. SeeAn Index to Creationist Claims PRATT list (points refuted a thousand times) CD011.1: Carbon-14 Variability Enjoyby our ability to understand Rebel☮American☆Zen☯Deist ... to learn ... to think ... to live ... to laugh ... to share. Join the effort to solve medical problems, AIDS/HIV, Cancer and more with Team EvC! (click)
|
||||||||||||||||||||||||||||||||||||||||
|
RAZD Member (Idle past 1436 days) Posts: 20714 From: the other end of the sidewalk Joined: |
Do you know if the field that is incremented steadily is the calendar dates and the one with scatter is the C14, or is the lookup table the other way around where you look up your C14 date on the steadily incremented column and then it gives you the actual date in the column with the scatter? Actually the incremental axis would be the raw calculated 14C age (the information you have available) and the scatter would be due to the year to year variation in original atmospheric levels of 14C and the number of possible matches for that level of 14C, the standard deviation comes from measurement error and they introduce some smoothing of the data that doesn't really affect the results significantly. You need to see it graphically for clarity: Again from my material for updating the age correlation thread:
Radiocarbon-Based Chronology for Dynastic Egypt (OK = Old Kingdom):
quote: Note that there are several other sample dates with similar correlation of 14C measurement to dendrochronology correlations, here it is the earliest/oldest set that is of interest as a measure of accuracy and precision. The dendrochronology correlation is shown as two lines in Fig 2 (+1σ and -1σ ) The earliest/oldest dates in Fig 2 are shown at ~2660 BCE, with 7 samples placed together (with two more placed nearby). There are several possible matches for each of these samples, running from 2580 BCE to 2860 BCE -- due to the wiggle of the 14C amounts in that portion of the graph -- I get 5 possible matches for the lowest point with an average age of 2693 BCE, 8 possible matches for the next point with an average of 2660 BCE, 6 possible matches for the third point for an average of 2702 BCE, 12 possible matches for the fourth point for an average of 2733 BCE, 9 possible matches for the fifth point for an average of 2754 BCE, 6 possible matches for the sixth point for an average of 2750 BCE, 8 possible matches for the seventh point for an average of 2771 BCE, 8 possible matches for the eight point for an average of 2787 BCE, and 6 possible matches for the highest point for an average of 2788 BCE. Assuming these points all represent the same age, the overall average age is ~2740 BCE with σ of +/-88 years (2827 BCE to 2651 BCE). Shaw's date for the tomb is 2660 BCE, so this is in close agreement with that dating. Note that +/-88 years in over 4,700 years of tree ring chronology is an error of +/-1.9%. The error is partly due to the two stage process of using 14C data to convert to dendrochronological calendar age, but mostly due to the wiggle of the 14C levels that match these points. Note that this conversion does not depend on the calculation of 14C 'age' -- that is a purely mathematical conversion of the measured amounts of 14C and 12C in the samples, and then comparing those 14C/12C values to ones found in the tree rings to find the best match to the tree rings, just as was done for the biblical history times above. This does, however,introduce an extra source of error due to the number of rings that match those levels inside the +/-1σ margins of error. Enjoy Edited by RAZD, : clrtyby our ability to understand Rebel☮American☆Zen☯Deist ... to learn ... to think ... to live ... to laugh ... to share. Join the effort to solve medical problems, AIDS/HIV, Cancer and more with Team EvC! (click)
|
||||||||||||||||||||||||||||||||||||||||
|
RAZD Member (Idle past 1436 days) Posts: 20714 From: the other end of the sidewalk Joined: |
You need to see it graphically for clarity: Oh, I've got it charted 6 ways to Sunday already (that's why I downloaded it). I'll be posting some charts with related questions in a bit, but to know what to ask I have to figure out which column is which.  Sorry I was referring to the graphical presentation of the data by Riemer et al (IntCal13): http://www.radiocarbon.org/IntCal13%20files/intcal13.pdf Note that the various sources of tree rings are very consistent through page 7 when they run out. Page 8 has a lot of scatter and a fair bit of it is likely due to the assumptions made on reservoir effect on the marine samples (see Corrections to radiocarbon dates.) btw CAL BP refers to calendar BP and not calibrated BP (even though this should be the same). I don't know how that table works - I've not looked at it. Maybe Coyote knows? Enjoyby our ability to understand Rebel☮American☆Zen☯Deist ... to learn ... to think ... to live ... to laugh ... to share. Join the effort to solve medical problems, AIDS/HIV, Cancer and more with Team EvC! (click)
|
||||||||||||||||||||||||||||||||||||||||
|
RAZD Member (Idle past 1436 days) Posts: 20714 From: the other end of the sidewalk Joined: |
I guess what I'm struggling with is calling the scientific position on this "assumptions" rather than conclusions based observed evidence. It seems to me that in the physical realm where we can explore, if floods really did sort by species at some point, then what we would find is fossils in flood sediment sorted by species, etc. We don't have to assume it wouldn't happen -- we can just look at the evidence. First off there are two versions of uniformitarianism: 1. The scientific position is that the laws of how things behaved have remained virtually the same, 2. The YEC (misrepresentation) is that it is in contrast to catastrophism, and thus assumes no catastrophes in the past. CD200: Uniformitarianism
quote: So confusing the issue with a different definition. Scientific law uniformitarianism can be tested:
There are many such examples.
I guess what I'm struggling with is calling the scientific position on this "assumptions" rather than conclusions based observed evidence. ... Well I would classify it more as a scientific "law" than an assumption (or a conclusion): somethings seen so pervasively (like gravity) that it hardly needs testing -- except to show YEC folks that it has been observed. As mentioned, wiki can be edited by anyone, and articles that some people find contentious (like evolution) periodically get "hit" with changes. IIRC Dr A discussed uniformitarianism in his book as it affect geology. There is also a discussion of how Lyell influenced Darwin at Page not found Enjoyby our ability to understand Rebel☮American☆Zen☯Deist ... to learn ... to think ... to live ... to laugh ... to share. Join the effort to solve medical problems, AIDS/HIV, Cancer and more with Team EvC! (click)
|
||||||||||||||||||||||||||||||||||||||||
|
RAZD Member (Idle past 1436 days) Posts: 20714 From: the other end of the sidewalk Joined: |
The quote in question is from this link: Answers to Creationist Attacks on Carbon-14 Dating | National Center for Science Education And here's the quote. I have green highlighted the part I am questioning.
quote: This is a slightly different take on their old argument that 14C is not in equilibrium in the atmosphere (so the earth is young), and -- like quote mining -- is it taking one piece of data out of context. The answer is correct, as far as it goes, but not as complete as it could be. Note that the date of Cook's claim is right at the peak of the bomb testing 14C generation (1966) -- and that creationists like to repeat old (falsified) arguments.
That means that Cook is using the bomb generated 14C as "natural" formation (which he then extrapolates into the past ignoring the data from pre testing times).
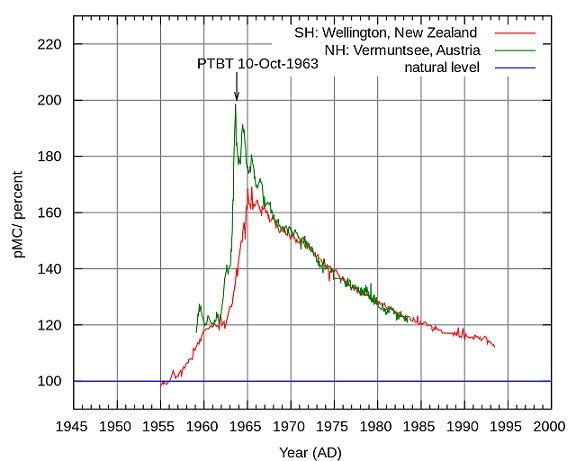
If as the chart shows (and I've seen many charts confirming this) C14 levels were still falling dramatically in 1982 after artificially high levels from open air bomb tests, how could C14 be forming faster than it was decaying. I haven't been able to find a graph that continues this reporting to the current day (2005 is the latest I've found and it was still falling at that time) to know what it's doing today. The Cook claim is not talking about today levels, which remain high from the testing. Note there are still bomb tests, and we also have Chernobyl and Fukushima that have caused measurable radioactivity in the atmosphere, so I would expect it to still be above normal sun cosmic ray generated 14C, but when you look at that graph you can see what looks like a pretty good exponential decay curve for it to continue dropping today towards the natural generation level on the chart -- ie it is currently decaying faster than it is being generated, and has been since 1966. Enjoyby our ability to understand Rebel☮American☆Zen☯Deist ... to learn ... to think ... to live ... to laugh ... to share. Join the effort to solve medical problems, AIDS/HIV, Cancer and more with Team EvC! (click)
|
||||||||||||||||||||||||||||||||||||||||
|
RAZD Member (Idle past 1436 days) Posts: 20714 From: the other end of the sidewalk Joined: |
Thanks for your response RAZD, but it seems to focus on the claim of Cook and I'm actually uninterested in the Cook claim (it's PRATT). I'm actually only interested in the assertion of the NCSE in 1982. I probably should have not confused the issue by even including Cook's nonsense - my bad. Ah. Well, it is always a good idea to look at where creationist information comes from that is behind their claims as a starting point. I can provide several examples where science provides information that is then misused\misidentified by creationists to "prove" the science wrong. This is a new one in the list for me. Certainly the timing of the Cook claim is important to see where he gets the "data" to extrapolate back in time -- data provided by science to show the effect of nuclear testing on 14C levels in the atmosphere. By simply ignoring the nuclear testing effect Cook claims that 14C production is increasing and increasing faster than it is decaying. Once this "meme" is introduced in Creationist circles it will get repeated ... even in 1982.
The article makes the 1982 claim that "C-14 is forming today faster than it's decaying." I find this claim contrary to the posted chart which documents a steadily declining percentage of C14 in the atmosphere. Surely if C14 was forming faster than it was decaying, the chart would have to show a increasing trend rather than decreasing. This is where Chris Weber's response is incomplete, or less complete than it could be. He should have - imho - addressed the time of the Cook claim and the conflation of nuclear (bomb) 14C and cosmic ray (natural) 14C, and then sorted out cosmic ray (natural) 14C production from total production. Instead his response is only related to the cosmic ray (natural) 14C fluctuations. Now look carefully at the chart again:
Compare the graph at 1981 and 1982: it is higher in 1982 than in 1981 because of the natural fluctuation in cosmic rays and hence in the production of 14C in the atmosphere by cosmic rays.
Is the problem caused by chart resolution? In other words, on average through the surrounding years it *was* decaying faster than it was forming, but in specifically 1982 there was a increase that the chart doesn't show? There certainly is some 'noise' in that data but I can't zoom in far enough to make that case. Seems doubtful. That "noise" in the data is the result of the natural variation of cosmic rays and the related production of atmospheric 14C -- it changes year to year. Weber's answer ...
Answer: Yes, Cook is right that C-14 is forming today faster than it's decaying. However, the amount of C-14 has not been rising steadily as Cook maintains; instead, it has fluctuated up and down over the past ten thousand years. How do we know this? From radiocarbon dates taken from bristlecone pines. ... is in relation to this natural variation from year to year ... and ignores the nuclear (bomb) 14C residual decay. His answer was written in 1982. AND part of the problem is that "natural level" 14C is portrayed on the chart as a flat line instead of showing the annual variations, so it should read "average natural level" or "1950 standard level" or something similar. Enjoy Edited by RAZD, : ...by our ability to understand Rebel☮American☆Zen☯Deist ... to learn ... to think ... to live ... to laugh ... to share. Join the effort to solve medical problems, AIDS/HIV, Cancer and more with Team EvC! (click)
|
||||||||||||||||||||||||||||||||||||||||
|
RAZD Member (Idle past 1436 days) Posts: 20714 From: the other end of the sidewalk Joined: |
Yeah, piss poor (at best unfortunate) wording IMO if you're trying to refute the claim. The logical conclusion of his statement "C-14 is forming today faster than it's decaying." is that concentrations of 14 were rising in the atmosphere, and while that could have been true during the single day (or perhaps even year) he wrote that, big picture truth is that he wrote it during the most dramatic decline in 14 concentrations in recorded history. It would appear that he didn't even think of looking at data for the chart, but just went with the standard response to the "equilibrium" type creationist argument ... Enjoyby our ability to understand Rebel☮American☆Zen☯Deist ... to learn ... to think ... to live ... to laugh ... to share. Join the effort to solve medical problems, AIDS/HIV, Cancer and more with Team EvC! (click)
|
||||||||||||||||||||||||||||||||||||||||
|
|
Do Nothing Button
Copyright 2001-2023 by EvC Forum, All Rights Reserved
![]() ™ Version 4.2
™ Version 4.2
Innovative software from Qwixotic © 2024