Register | Sign In


Understanding through Discussion


EvC Forum active members: 65 (9164 total)
3 online now:
Newest Member: ChatGPT
Post Volume: Total: 916,909 Year: 4,166/9,624 Month: 1,037/974 Week: 364/286 Day: 7/13 Hour: 0/2


Thread  Details

Email This Thread
Newer Topic | Older Topic
  
Author Topic:   Age Correlations and an Old Earth: Version 1 No 3 (formerly Part III)
RAZD
Member (Idle past 1435 days)
Posts: 20714
From: the other end of the sidewalk
Joined: 03-14-2004


Message 186 of 357 (393439)
04-05-2007 7:42 AM
Reply to: Message 182 by Reserve
04-04-2007 10:09 PM


Correlations is the game
And another paper speaks of the U Pb method, how it too is very unreliable.
You're job is not just to explain possible sources of errors in the dating but to explain the correlations between them: why they produce similar dates with different methods and have similar correlations to climate and other incidents:
From Message 9 (the updated version of this thread that has not been promoted yet), note the correlations between the two different radiometric dating methods and the climate data from the ice cores for the same ages derived there by counting layers of ice - to invalidate these dates you need to show how two different radiometric methods are subject to the same age error, how the ice layers result in the same age error and how the 18O data correlates between the two:
quote:

Age Correlations and An Old Earth (ver 2 no 1)
The Devil's Hole

Now we have reached nearly a million years for the age of the earth by methods that count annual layers, each step along the way validating the method and age that was arrived at with the previous step. We are way past any age that can possibly be called a "young" earth concept, but we have not yet reached beyond the age of hominid fossils (although we are beyond the fossil record for Homo sapiens), and we still have a ways to go to get to billions of years.
We may have reached the limits of annual counting systems to measure the age of the earth, but there are other ways to measure age. We could talk about dating from the radioactive decay carbon-14, using the information from IntCal04, dendrochonology and the Lake Suigetsu varves, however the carbon-14 dating is complicated by the carbon-14 content being variable in the atmosphere, so the initial amount in samples is variable. The purpose of calibration curves is to reduce the error due to the variations in initial carbon-14 content of the atmosphere.
To discuss radioactive decay and dating systems that are based on this concept we need a system not subject to this kind of variation. We also need one that can be correlated over substantial time to validate the system.
USGS URL Resolution Error Page (2)
quote:
Devils Hole is a tectonically-formed subaqueous cavern in south-central Nevada. Vein calcite, which coats the walls of this cavern, has provided an extremely well-dated 500,000-year record of variations in temperature as well as other paleoclimatic parameters.
We have correlations between age, climate and temperatures, so how is this data evaluated?
http://pubs.usgs.gov/of/1997/ofr97-792/ (3)
quote:
Devils Hole is a tectonically formed cave developed in the discharge zone of a regional aquifer in south-central Nevada. (See Riggs, et al., 1994.) The walls of this subaqueous cavern are coated with dense vein calcite which provides an ideal material for precise uranium-series dating via thermal ionization mass spectrometry (TIMS). Devils Hole Core DH-11 is a 36-cm-long core of vein calcite from which we obtained an approximately 500,000-year-long continuous record of paleotemperature and other climatic proxies. Data from this core were recently used by Winograd and others (1997) to discuss the length and stability of the last four interglaciations.
Carbon and oxygen stable isotopic ratios were measured on 285 samples cut at regular intervals inward from the free face of the core (as reported in Winograd et al. ,1992, and in Coplen et al., 1994). Table 1 lists only 284 samples because a sample taken at 114.28 mm was eliminated when post-1994 reanalysis of its delta 18O value indicated an error in the earlier determination. Carbon isotopic ratios are reported in per mill (footnote #1) relative to VPDB, defined by assigning a delta 13C of +1.95 per mill to the reference material NBS 19 calcite. Oxygen isotopic ratios are reported relative to VSMOW reference water on a scale normalized such that SLAP reference water is -55.5 per mill relative to VSMOW reference water. The oxygen isotopic fractionation factors employed in this determination are those listed in Coplen and others (1983). The delta 18O value of the isotopic reference material NBS 19 on this scale is +28.65 per mill. The 1 sd (standard deviation) error for the delta 18O and delta 13C analyses is 0.07 and 0.05 per mill, respectively.
They measured the age with a radiometric decay system and also measured d18O and d13C as measures of climate. There is a table with the 284 samples by age with d18O and d13C values. For a correlation of that data to the age and climate information we have already see we turn to
USGS URL Resolution Error Page (8)
quote:
The Devils Hole d18O record is an indicator of paleotemperature and corresponds in timing and magnitude to paleo-SST (sea surface temperature) recorded in Pacific Ocean sediments off the California and Oregon coasts. The record is also highly correlated with major variations in temperature in the Vostok ice core, from the East Antarctic plateau. The d13C record is thought to reflect changes in global variations in the ratio of stable carbon isotopes of atmospheric CO2 and/or changes in the density of vegetation in the groundwater recharge areas tributary to Devils Hole.
(See Winograd et al., 1996; Herbert et al., 2001; Winograd, 2002; Winograd, et al., 1997; Landwehr and Winograd, 2001; Landwehr, 2002; and Coplen, et al., 1994.)
As eminent a geochemist as W. Broecker has stated that "...the Devils Hole chronology is the best we have..." Since 1992, all core material has been uranium-series dated using thermal ionization mass spectrometric (TIMS) methodology. In 1997, the Devils Hole Thorium-230 dates were independently confirmed by non-USGS investigators using Protactinium-231.
(See Broecker, 1992; Ludwig, et al., 1992; Winograd, et al., 1997; and Edwards, et al., 1997.)
Note - "highly correlated" with climatological data from the Vostok ice core data, which "matches almost perfectly" the climatological data from the Greenland ice core data. Corroborated by two independent radiometric methods. The oldest date in the data table is 567,700 years ago.
So what exactly do we have here? Water dripping down a cave wall, depositing calcite and various other minerals and impurities, elements that are soluble in water, including trace levels of radioactive isotopes of uranium. Material that gets deposited as the water evaporates, forming layer after layer of similar deposits, each one trapping the material in their respective layers. The calcite forms a matrix that holds the impurities, minerals and trace elements in a position related to the time the calcite was deposited.
Calcite - Wikipedia (1)
quote:
The carbonate mineral calcite is a chemical or biochemical calcium carbonate corresponding to the formula CaCO3 and is one of the most widely distributed minerals on the Earth's surface. It is a common constituent of sedimentary rocks, limestone in particular. It is also the primary mineral in metamorphic marble. It also occurs as a vein mineral in deposits from hot springs, and also occurs in caverns as stalactites and stalagmites. Calcite is often the primary constituent of the shells of marine organisms, e.g., plankton (such as coccoliths and planktic foraminifera), the hard parts of red algae, some sponges, brachiopoda, echinoderms, most bryozoa, and parts of the shells of some bivalves, such as oysters and rudists). Calcite represents the stable form of calcium carbonate; aragonite will change to calcite at 470C.
Radioactive elements decay into other elements, and some of these are not soluble, and thus the presence of these insoluble daughter elements is evidence of decay of the soluble parent elements. These daughter elements are still trapped in the layers of calcite that the parent elements were depositied in, so their position also relates to the age of the daughter elements in the calcite layers. We are interested in four isotopes of these matrix constrained elements, two radoactive - thorium-230 and protactinium-231 - and two not radioactive - oxygen-18 and carbon-13 - and what they can tell us about climate and age.

Thorium-230

Radiometric Dating (9)
quote:
Two of the most frequently-used of these "uranium-series" systems are uranium-234 and thorium-230.
Like carbon-14, the shorter-lived uranium-series isotopes are constantly being replenished, in this case, by decaying uranium-238 supplied to the Earth during its original creation. Following the example of carbon-14, you may guess that one way to use these isotopes for dating is to remove them from their source of replenishment. This starts the dating clock. In carbon-14 this happens when a living thing (like a tree) dies and no longer takes in carbon-14 laden CO2. For the shorter-lived uranium-series radionuclides, there needs to be a physical removal from uranium. The chemistry of uranium and thorium are such that they are in fact easily removed from each other. Uranium tends to stay dissolved in water, but thorium is insoluble in water. So a number of applications of the thorium-230 method are based on this chemical partition between uranium and thorium.
On the other hand, calcium carbonates produced biologically (such as in corals, shells, teeth, and bones) take in small amounts of uranium, but essentially no thorium (because of its much lower concentrations in the water). This allows the dating of these materials by their lack of thorium. A brand-new coral reef will have essentially no thorium-230. As it ages, some of its uranium decays to thorium-230. While the thorium-230 itself is radioactive, this can be corrected for. The equations are more complex than for the simple systems described earlier, but the uranium-234 / thorium-230 method has been used to date corals now for several decades. Comparison of uranium-234 ages with ages obtained by counting annual growth bands of corals proves that the technique is highly accurate when properly used (Edwards et al., Earth Planet. Sci. Lett. 90, 371, 1988). The method has also been used to date stalactites and stalagmites from caves, already mentioned in connection with long-term calibration of the radiocarbon method. In fact, tens of thousands of uranium-series dates have been performed on cave formations around the world.
As with all dating, the agreement of two or more methods is highly recommended for confirmation of a measurement.
At the Devil's Hole we are essentially dealing with one very large stalactite. The calcite was deposited after being dissolved in water, the Th-230 in the calcite could only come from the decay of the parent U-234, giving an accurate measurement of the age of the layers of calcite.
Note this mentions dating marine corals by the same method, and we saw this noted with the Lake Suigetsu data.
See also Thorium - Wikipedia(7). Thorium-230 has a half-life of 75,380 years.

Protactinium-231

http://www.ead.anl.gov/pub/doc/protactinium.pdf (5)
quote:
Protactinium is a malleable, shiny, silver-gray radioactive metal that does not tarnish rapidly in air. It has a density greater than that of lead and occurs in nature in very low concentrations as a decay product of uranium. There are three naturally occurring isotopes, with protactinium-231 being the most abundant. ... The other two naturally occurring isotopes are protactinium-234 and protactinium-234m (the “m” meaning metastable), both of which have very short half-lives (6.7 hours and 1.2 minutes, respectively) and occur in extremely low concentrations.
Protactinium-231 is a decay product of uranium-235 and is present at sites that processed uranium ores and associated wastes. This isotope decays by emitting an alpha particle with a half-life of 33,000 years to actinium-227, which has a half-life of 22 years and decays by emitting an alpha or beta particle.
Protactinium is widely distributed in very small amounts in the earth’s crust, and it is one of the rarest and most expensive naturally occurring elements. It is present in uranium ores at a concentration of about 1 part protactinium to 3 million parts uranium. Of the three naturally occurring isotopes, protactinium-231 is a decay product of uranium-235, and protactinium-234 and protactinium-234m are decay products of uranium-238.
The U-235 to Pa-231 decay is from a different series than the U-234 to Th-230 decay, so the two are independent of each other. Again, as the Devil's Hole calcite was deposited after being dissolved in water, the Pa-231 in the calcite could only come from the decay of the parent U-235, giving an accurate measurement of the age of the layers of calcite.
See also Protactinium - Wikipedia(6). Protactinium-231 has a half-life of 32,760 years.

Radioactive Decay

We also saw above that the radiation decay curve is exponential, with different results for different decay constants - the half-lives of the radioactive isotopes.
Exponential decay - Wikipedia (4)
quote:
A quantity is said to be subject to exponential decay if it decreases at a rate proportional to its value. Symbolically, this can be expressed as the following differential equation, where N is the quantity and λ is a positive number called the decay constant:
N(t) = N0e-λt

Here N(t) is the quantity at time t, and N0 = N(0) is the (initial) quantity, at time t=0.
If the decaying quantity is the number of discrete elements of a set, it is possible to compute the average length of time for which an element remains in the set. This is called the mean lifetime, and it can be shown that it relates to the decay rate,
T = 1/λ

The mean lifetime (also called the exponential time constant) is thus seen to be a simple "scaling time"

A more intuitive characteristic of exponential decay for many people is the time required for the decaying quantity to fall to one half of its initial value. This time is called the half-life, and often denoted by the symbol t1/2. The half-life can be written in terms of the decay constant, or the mean lifetime, as:
t1/2 = ln2/λ = Tln2

When this expression is inserted for T in the exponential equation above, and ln2 is absorbed into the base, this equation becomes:
N(t) = N02-t/t1/2

Using the half-lives of thorium-230 (75,380 years) and protactinium-231 (32,760 years), we can now draw the exponential curves for these isotopes (with % on the y-axis and time in k-yrs on the x axis, thorium in blue and protactinium in red):
This means we have a series of data with three different pieces of information: calcite layer age, Thorium-230 content and Protactinium-231 content. We also note that Thorium-230 has a half-life of 75,380 years, while Protactinium-231 has a half-life of 32,760 years - less than half the half-life of Thorium-230. This means that layer by layer the ratio of Thorium-230 to Protactinium-231 is different:
  Age   THr=THf/THo   PAr=PAf/PAo   THr/PAr
------------------------------------------
75,380 0.5000 0.2029 2.46
150,760 0.2500 0.0412 6.07
226,140 0.1250 0.0084 14.96
301,520 0.0625 0.0017 36.86
376,900 0.0313 0.0003 90.82
452,280 0.0156 0.0001 223.77
527,660 0.0078 0.00001 551.35
So for these dates to be invalid there would have to be a mechanism that can layer by layer preferentially change the ratio of these two {elements\isotopes} within the solid calcite vein.

The Climate Correlation

Buried in the calcite layers are also the elements of oxygen and carbon, and the ratios of oxygen-18 to oxygen-16 and of carbon-13 to carbon-12 are markers of climate. These ratios are like the tree-rings climate data used to match different samples and different dendrochronologies, except that we have two sets of data instead of just one, and these do not decay or change over time once they are buried in the calcite. The climate data from 18O is validated by the 13C values.
Based on the ages determined from the radioactive decay of thorium and protactinium the values for 18O and 13C values were tabulated and these climate patterns were compared to those of the ice cores. The result was that they were "highly correlated" with climatological data from the Vostok ice core data, which "matches almost perfectly" the climatological data from the Greenland ice core data. Thus the climate correlation shows that the ages determined by the radioactive decay match the ages determined from counting the layers of ice in these cores - highly correlated between two climate measures, two radioactive age measures, two ice cores.
One could say that this data validates the age of the Devil's Hole calcite, but that is not really what is being validated here - we've already validated the calcite with the Vostok Ice Core data and other data - instead this validates the theoretical basis for radiometric dating as being accurate and valid.
This means that any young earth creation (YEC) model suggesting different rates of radioactivity before a world wide flood (WWF) for this period of time is also invalid, as this would not explain the change in ratio of these elemental isotopes layer by layer by layer by layer for 567,700 layers. This also invalidates the occurrence of a WWF during the data period as that would have produced a change in the Thorium-230 content and Protactinium-231 content compared to the calcite layer age.

Conclusions

Based on this information alone we can conclude:
  • The theoretical basis for radiometric dating is accurate and valid.
  • The two different radiometric methods are equally valid - at least as far back as 567,700 yr BP.
  • That there was no change in the behavior of radioactive materials in the last 567,700 years, and
  • The world is older than 567,000 years and no global flood has occurred in that time.
Enjoy.


References:
  1. Anonymous "Calcite" Wikipedia. updated 25 Jan 2007. accessed 27 Jan 2007 from Calcite - Wikipedia
  2. Anonymous "Devil's Hole" Department of the Interior, US Geological Survey National Research Program updated: 26 Jan, 2006. accessed 10 Jan 2007 from USGS URL Resolution Error Page
  3. Anonymous "Data for Devil's Hole Core DH-11" Department of the Interior, US Geological Survey National Research Program. updated 1 Sep 2005. accessed 10 Jan 2007 from http://pubs.usgs.gov/of/1997/ofr97-792/
  4. Anonymous "Exponential Decay" Wikipedia. updated 8 Jan 2007. accessed 10 Jan 2007 from Exponential decay - Wikipedia
  5. Anonymous "Human Health Fact Sheet: Protactinium" Argonne National Laboratory, EVS, August 2005. accessed 10 Jan 2007 from http://www.ead.anl.gov/pub/doc/protactinium.pdf
  6. Anonymous "Protactinium" Wikipedia. updated 23 Dec 2006. accessed 10 Jan 2007 from Protactinium - Wikipedia
  7. Anonymous "Thorium" Wikipedia. updated 3 Jan 2007. accessed 10 Jan 2007 from Thorium - Wikipedia
  8. Landwehr, J. M. and Winograd, I. J. "A Devil's Hole Primer" Department of the Interior, US Geological Survey National Research Program updated: 29 Dec 2004. accessed 10 Jan 2007 from USGS URL Resolution Error Page
  9. Wiens, Roger C. "Radiometric Dating: A Christian Perspective." The American Scientific Affiliation: A Fellowship of Christians in Scientists. First edition 1994; revised version 2002. accessed 10 Jan 2007 from Radiometric Dating

Where possible the standard academic procedure I have tried to follow for citing online publications where you last accessed this page on January 30, 2007, and used version 2 number 1:
Smith, Paul "Age Correlations and An Old Earth: The Devil's Hole." EvC Forum. Ver 2 no 1 updated 27 Jan 2007 accessed 30 Jan, 2007 from http://< !--UB EvC Forum: Dates and Dating -->http://EvC Forum: Dates and Dating -->EvC Forum: Dates and Dating< !--UE-->
Here is a link to formal MLA style referencing.
I await your information on these correlations. Without explaining these correlations this shows that these dates are indeed valid and the methods for obtaining them resulted in accurate results.
Note too that the ice core data correlates between arctic and antarctic cores, so you have four sets of data with the same results.
Enjoy.
Edited by RAZD, : fixed table

Join the effort to unravel AIDS/HIV, unfold Proteomes, fight Cancer,
compare Fiocruz Genome and fight Muscular Dystrophy with Team EvC! (click)


we are limited in our ability to understand
by our ability to understand
RebelAAmericanOZen[Deist
... to learn ... to think ... to live ... to laugh ...
to share.

This message is a reply to:
 Message 182 by Reserve, posted 04-04-2007 10:09 PM Reserve has replied

Replies to this message:
 Message 187 by Reserve, posted 04-05-2007 4:28 PM RAZD has replied

RAZD
Member (Idle past 1435 days)
Posts: 20714
From: the other end of the sidewalk
Joined: 03-14-2004


Message 189 of 357 (393590)
04-05-2007 8:49 PM
Reply to: Message 187 by Reserve
04-05-2007 4:28 PM


Re: Correlations is the game
But one source mentioned that the 'pigs took it all' in that the correlation between radiometric dating didn't matter at that time.
I haven't read the paper yet and have no idea what they mean by "'pigs took it all'" but I will make these predictions:
  • the radiometric dates were not of the fossils themselves but of sediment layers above and below the fossils,
  • these samples were taken to bracket the age of the fossils,
  • the dates older than the fossils all come from sedimentary layers below the fossils,
  • the dates younger than the fossils all come from sedimentary layers above the fossils,
  • the published age of the fossils falls in the gap between the older sedimentary dates and the younger sedimentary dates,
  • that the article (the science one, not the answersingenesis one) gives the reasons for these dates being what they are.
I do this based on my knowledge of science, the ways they do the dating, and the ways that answersingenesis (AiG) misrepresents these kinds of things to fool gullible people -- those that don't check the stories against the facts.
That the correlation was disregarded due to the pigs. So why would it matter here?
First, we are talking about a different {level\kind} of correlation. In your article they are (presumably) talking about the agreement between the different dates for the samples involved, and only over a short portion of time (relatively speaking), and not correlations with any other data (such as on climate). In the case I presented we are talking about the year by year, layer by layer correlation between not only dates but climate markers as well: dates from two different radiometric clocks in the core samples with the 18O data; dates from the two different ice cores with the same kind of 18O information from the ice cores. The correlations between the ages and the climate data match year by year and layer by layer for all four different measurement data: two locked in rock together for eons, and two from opposite ends of the earth, as divergent as possible. It's like the difference between a 2D point on a chart and a 3D curve that covers from now to 500,000 years ago.
Second, there is always the possibility of contamination and bad samples (not from close enough in time to the fossils in question due to processes that have removed or added material after the fossils were formed, and the like). That there are some bad dates does not mean that all dates are bad. The scientists know this. The people at AiG know this. The scientists tell you that sometimes the dates are bad. The people at AiG tell you that all dates are bad. Who is most likely to be misrepresenting the facts based on just this information? If you trust AiG you better never buy an apple after getting a bad one.
The problem for you is that even IF what AiG says is true then the data from Devil's Hole must show at least ONE of these cases:
  • high variability of dates in the core with some older levels dating younger and the like: this is not the case.
  • a shift in dates to either all younger or all older and a widening divergence between the two radiometric systems: this is not the case.
  • no correlation between age and the 18O levels for the same age from the ice cores: this is not the case.
  • a single age for all levels due to contamination: this is not the case.
The data from the core show exactly the distribution in time that is predicted by radiactive decay, an exponential curve that matches the half-life curves for both of the radioactive methods involved.
The problem that AiG parades and trumpets for you does not explain the match of physical data to the theoretical data NOR the correlations between the two radiometric ages and the 18O levels for the same age from the ice cores. Without those correlations being explained by SOME mechanism that can produce those numbers, the data from Devil's Hole shows layer by layer, year by year, validated ages that exceed 500,000 years. This level of validated years vastly exceeds (and invalidates) any young earth model. With the YEC model invalidated we can now turn to what is the real age of the earth and leave those that insist on a young earth (AiG) behind as representatives of a falsified belief.
quote:
The Greenland Society of Atlanta has recently attempted to excavate a 10-foot diameter shaft in the Greenland ice pack to remove two B-17 Flying Fortresses and six P-38 Lightning fighters trapped under an estimated 250 feet of ice for almost 50 years (Bloomberg, 1989).
Predictable. A hoary old PRATT (point refuted a thousand times). Google it and see. These depths have nothing to do with the annual layers of snow: layers that are not deliniated by thickness but by physical changes in the ice that are due to winter\summer cycles (and not to storms, etc). The location here is also not remotely related to the one where the ice cores are taken. Now we see that ICR (just like AiG) is misrepresenting the truth of the matter to you and expecting you to swallow it without checking the facts. That is how scam artists and cons work eh?
The problem for you is that even IF what ICR says is true then the data from Arctic and Antarctic ice cores should show at least ONE of these cases:
  • high variability of dates between the two sets of ice core data, with some older levels dating younger and the like when comparing markers in the ice from other events (like volcanos): this is not the case.
  • a shift in dates to either all younger or all older and a widening divergence between the two ice core systems when comparing markers: this is not the case.
  • no correlation between age and the 18O levels for the same age between the ice cores: this is not the case.
The problem for you is that even IF what AiG or ICR says is true about EITHER ONE of these dating mechanisms, that then there should be no correlation between the two entirely different sets of data formed by entirely different physical processes: this is not the case.
CONCLUSION: What AiG and ICR (in many cases it is the same people anyway) says about the accuracy of either of these dating methods is invalid.
I used also pointe out a reference that said that evolutionary old age assumptions are used prior to get old dates and agreement between them, this was explained as circular reasoning and why you get corrolation.
Of course they tell you this and other misrepresentations. Instead of taking their word for it why don't you find out for yourself? Look it up on Wiens. Check it out and see: is AiG telling you the truth?
So it seems that there are more complicated things to take into account that uniformatarians are not doing. Their assumption that 'the present is the key to the past' is leading them to false answers.
Who and what are "uniformatarians" and how do they relate to the way that science does science? You do know what a straw man argument is don't you? Where you make up some shadow opposition and then prove that shadow wrong, when it has nothing to do with the facts, eh?
Science makes no assumptions that yesterday was the same as today, in fact by NOT making any assumption of any kind of "uniform" conditions we have a scientific past that includes among other things (1) a meteor that nearly wiped all life from the face of the earth 65 million years ago - detected by the presence of iridium in sedimentary layers that are the same age around the world - and (2) massive climate swings from ice ages to hothouses and back and forth several times in the past.
What science assumes is that the natural laws that apply today - to physics, chemistry, biology, astronomy, etc. continue to apply because there is no evidence that (1) they have changed in the past or (2) that they can change.
Without any record of any such changes in the past it is not logical to consider them: that alone is reason to assume that the natural laws continue to operate in the past the same as they operate in today's world and through all of human history.
But without any mechanism that could cause such changes it is unscientific to consider them. Now if you think there is some mechanism that causes natural laws to change then by all means present it and lets see how it tests out. And I don't mean some hypothetical what if certain things changed - I've had enough "what-if" stories - but a specific mechanism that causes natural laws to change, how it causes those changes and specifically what the changes are. What does it predict and how does it explain the correlations in the dates for Devil's Hole and the Ice Cores.
Now if you want to pretend that supernatural laws took over at some point in the past then you can do that. That, however, is not science, and it is not logic. It is fantasy, science fiction, mythology, and what is known in logic as special pleading: the proposition that anything you propose be taken as true and not subject to the same degree and kind of testing as your opposition.
You see why I have trouble agreeing with your statements? In my eyes, the interpretations you are bringing forward, are not taking into account Noah's flood, but that is because they do not believe it happened. (you might say for good reasons).
Noah's flood does not explain the existence to say nothing of the correlations in the data from all the different methods for finding ages of different parts of the earth: your "good reason" being not just the lack of evidence for a flood, but the evidence that it COULD NOT have occurred in the time scales of Devil's Hole and the Ice Cores (they would not have survived such an occurrence).
Heck, the concept that a world wide flood occurred at some time in the last 12,000 years is invalidated by the tree ring data that extends back that far that shows continuous year by year unbroken growth of trees for that depth of the past. This is further extended by other annual systems, but this ALONE shows a YEC model young earth to be invalid and it is not even the tip of the iceberg of data for an old earth.
It's not a matter of different interpretations, it is a matter of which interpretation covers all the evidence and which one leaves many cases of contradictory evidence unexplained.
Denial of contradictory evidence is NOT a "different" interpretation it is a LACK of interpretation. Denial of contradictory evidence is not faith or interpretation it is:
de·lu·sion -noun1. an act or instance of deluding.
2. the state of being deluded.
3. a false belief or opinion: delusions of grandeur.
4. Psychiatry. a fixed false belief that is resistant to reason or confrontation with actual fact: a paranoid delusion.
And the only question is what level of delusion we are talking about: one can remove oneself from a state of being deluded by getting educated on the facts, and by severing oneself from those that are doing the deceiving, after one uncovers their deceits.
How do you test your knowledge of reality? By taking someone's word for it or by looking at the evidence yourself? Are you more or less skeptical of someone else's position because it is what you want to believe?
Enjoy.
Edited by RAZD, : corrected aig to icr (big difference eh?)
Edited by RAZD, : would not have survived

Join the effort to unravel AIDS/HIV, unfold Proteomes, fight Cancer,
compare Fiocruz Genome and fight Muscular Dystrophy with Team EvC! (click)


we are limited in our ability to understand
by our ability to understand
RebelAAmericanOZen[Deist
... to learn ... to think ... to live ... to laugh ...
to share.

This message is a reply to:
 Message 187 by Reserve, posted 04-05-2007 4:28 PM Reserve has not replied

Replies to this message:
 Message 190 by JonF, posted 04-06-2007 10:09 AM RAZD has seen this message but not replied

RAZD
Member (Idle past 1435 days)
Posts: 20714
From: the other end of the sidewalk
Joined: 03-14-2004


Message 193 of 357 (393762)
04-06-2007 8:40 PM
Reply to: Message 187 by Reserve
04-05-2007 4:28 PM


pearls
quote:
The first attempt to date the KBS Tuff was in 1969, well before the discovery of skull 1470. Richard Leakey supplied rock samples to F.J. Fitch (Birkbeck College, University of London) and J.A. Miller (Cambridge University) ” recognized authorities in potassium-argon (K-Ar) dating.
Fitch and Miller's first analysis gave evolutionary dates from 212 million to 230 million years of age. Concerning this they said, 'From these results it was clear that an extraneous argon age discrepancy was present ...'.2
So before the KNM ER 1470 fossil was found the KBS tuff was dated and the dating was questioned. What we don't have are the reasons that it was "clear that an extraneous argon age discrepancy was present" -- is this a lie of omission?
This would be given in the reference, but this part was not quoted by AiG, so I'll need to access this from the library to find out:
2. F.J. Fitch and J.A. Miller, 'Radioisotopic Age Determinations of Lake Rudolf Artifact Site', Nature 226, April 18, 1970, p. 226.
Looking for what I could find on the web I looked at TalkOrigins.org and what they had to say about the KBS tuff" and they had two different articles on it, one on "Creationist Claims" (about the KBS tuff) and one on radiometric dating methods in general:
(1) "Creationist Claims"
quote:
Claim CD031:
The KBS Tuff is an ash layer in the Koobi Fora Formation east of Lake Turkana in northern Kenya. It is significant because hominid fossils and artifacts were found in and under it, so its age gives a minimum age of the fossils. Various attempts to date it have yielded a wide range of different results, from 0.52 to 220 million years. The dating of the KBS Tuff exposes the fallacies of radiometric dating. "Good" dates are chosen to accord with accepted dates of fossils, while anomalous dates may not be reported at all. And in practice, it is impossible to be sure one has selected uncontaminated samples.
Response:
1. The KBS Tuff controversy illustrates many of the problems with radiometric dating, but it equally illustrates that the problems are not insurmountable.
The KBS Tuff (for "Kay Behrensmeyer Site," after the geologist who first described it) is a layer of redeposited volcanic ash, so it contains a mixture of older sediments, too. It is still possible to date the layer, but care must be taken to choose only the youngest rocks, else one would be dating the age of older sediments washed into the layer, not the age of the layer itself. This is what happened with the first ages reported from the tuff. In a study to test the feasibility of dating samples from the tuff, the samples were contaminated with non-juvenile components which could not be separated out, giving ages over 200 million years. It was recommended that new samples be collected from which suitable individual crystals could be separated (Fitch and Miller 1970). These new samples were dated at 2.61 +/- 0.26 million years, based on the 40Ar/39Ar dating method (Fitch and Miller 1970).
Discrepancies with this date soon turned up, though. Work with animal fossils, particularly of pigs, showed that the strata in question matched younger strata in the nearby Omo Valley. In its early stages, this fossil work was imprecise enough that the 2.61 Myr date could still be justified (Maglio 1972). However, the fossils continued to point to a younger date as the quality of the work on them improved (White and Harris 1977). And in 1975, another lab, using K-Ar dating, reported dates of 1.82 and 1.60 Myr (Curtis et al. 1975).
Fitch and Miller turned to an independent method to resolve the discrepancy, fission-track dating. Initial results gave an age of 2.44 +/- 0.08 Myr (Hurford et al. 1976). This fit well with the age of 2.42 Myr, which Fitch et al. (1976) recalculated from their original results. Subsequent 40Ar/39Ar measurements they took gave a scattering of ages from 0.52 +/- 0.33 to 2.6 +/- 0.3 Myr. They attributed the spread to reheating of the crystals after deposition. Paleomagnetic studies gave ambiguous results (Brock and Isaac 1974; Hillhouse et al. 1977).
The weight of evidence soon began to converge on an age near 1.9 Myr, though. A study of trace elements in the minerals showed that the KBS Tuff correlates with the H2 tuff in the Shungura Formation, uncontroversially dated about 1.8 Myr (Cerling et al. 1979). The 1.60 Myr age reported by Curtis et al. (1975) was found to be an error due to a faulty balance (Drake et al. 1980). A later fission-track study which took pains to eliminate possible errors gave an age of 1.87 +/- 0.04 Myr (Gleadow 1980). Because the controversy had become quite heated, another expert, Ian McDougall, was called in to do independent dating. He came up with an age of 1.89 +/- 0.01 using K-Ar dating and 1.88 +/- 0.02 using 40Ar/39Ar dating (McDougall et al. 1980; McDougall 1981, 1985). Geological evidence and the consistency of dates derived from various sources indicates that reheating after deposition is unlikely.
The lessons to be learned from the KBS Tuff dating controversy are not that radiometric dating does not work, but that it works with some caveats.
  • Some formations are easier to date than others. The KBS Tuff was particularly difficult to date because it included volcanic sediments of several different ages. Furthermore, it looked the same as other tuffs, so care was needed to make sure the same layer was being referred to in different areas. All of this requires careful work from knowledgeable geologists. Were it not for its importance to determining the ages of important hominid fossils, geologists probably would not have bothered with dating it at all.
  • Some dating techniques are simply inappropriate in some circumstances. As noted above, paleomagnetic study is not particularly useful at this site.
  • Discrepant dates are not dismissed out of hand. In addition to trying to resolve the issue with further dating, the discrepancies caused people to look for the sources of error. The original erroneous date by Fitch and Miller could be an accurate date of a roughly 2.5 Myr ash layer, present in neighboring areas but apparently eroded from the Koobi Fora Formation. Apparently, some pumice from that volcanic event had been incorporated into the KBS Tuff. Samples sent to an independent lab for "blind" dating confirmed its older age (Fitch et al. 1996). Alternatively, this and other discrepant ages may be due to contamination with older material. Such contamination caused ages in the 2.0 - 6.2 Myr range in the analysis of Curtis et al. (1975) until they revised their sample purification procedures. A high atmospheric argon contamination in their samples and analytical errors may have contributed, too (McDougall et al. 1980).
  • The fission-track study which gave the 2.44 Myr age was the first such study to date zircons so young. The reanalysis by Gleadow (1980) noted problems with the standard methods and contributed new methodology for dealing with zircons with low track densities.
  • People's preconceptions and personalities can get in the way of evaluating the data objectively. In the KBS Tuff controversy, personality conflicts may have contributed to delay in the resolution and certainly contributed to the drama. But in the end, the objective evidence is a constraint that every scientist must meet. Replication, free access to information, and awareness of conflicts of interest help assure that personal foibles do not determine outcomes. Because such mechanisms were in place, all of the scientists who initially supported the older 2.6 Myr date for the KBS Tuff later came to accept the 1.88 Myr age (Lewin 1987).
Note that different methods give the same results when known sources of error are removed. K-Ar, 40Ar/39Ar, and fission-track methods ultimately all gave the same results. These results were correlated with strata of the same age at other locations on the basis of fossil and trace element analysis.
2. The different ages which were seriously debated for the KBS Tuff, from 1.6 to 2.6 million years, were never close to ages required by young-earth creationism.
Color mine for empHASis. Sounds like they nailed the AiG claim eh? And then show that the AiG claim about not being able to find good samples was false even for such a problematic deposition.
All the radiometric dates given above (2.61, 1.82, 1.60, 2.44, 1.87, 1.88, 1.89) average out to 2.02 myr ago with a standard deviation of 0.34 myr (17%) -- ie just based on these data alone the age should be between 1.68 myr and 2.35 myr. In the absence of any other data this is still sufficient to show that the earth and the fossils are substantially older than any possible YEC explanation.
Also note here that it is not the age of the pigs, but the sedimentary layer that the pigs were found in that was used to show the age: this is old geology that pre-dates radiometric methods, and uses relative ages of sedimentary layers to organize the fossil finds - the pig fossils are dated by the geological layer.
(2) "Radiometric Dating and the Geological Time Scale
Circular Reasoning or Reliable Tools?"

Radiometric Dating and the Geological Time Scale
quote:
Specific Examples: When Radiometric Dating "Just Works" (or not)
A poor example
There are many situations where radiometric dating is not possible, or where a dating attempt will be fraught with difficulty. This is the inevitable nature of rocks that have experienced millions of years of history: not all of them will preserve their age of origin intact, not every rock will have appropriate chemistry and mineralogy, no sample is perfect, and there is no dating method that can effectively date rocks of any age or rock type. For example, methods with very slow decay rates will be poor for extremely young rocks, and rocks that are low in potassium (K) will be inappropriate for K/Ar dating. The real question is what happens when conditions are ideal, versus when they are marginal, because ideal samples should give the most reliable dates. If there are good reasons to expect problems with a sample, it is hardly surprising if there are!
For example, in the "Dating Game" appendix of his "Bones of Contention" book (1992), Marvin Lubenow provided an example of what happens when a geologically complicated sample is dated -- it can be very difficult to analyze. He discussed the "KBS tuff" near Lake Turkana in Africa, which is a redeposited volcanic ash. It contains a mixture of minerals from a volcanic eruption and detrital mineral grains eroded from other, older rocks. It is also a comparatively "young" sample, approaching the practical limit of the radiometric methods employed (conventional K/Ar dating), particularly at the time of the initial dating attempts in 1969. If the age of this unit were not so crucial to important associated hominid fossils, it probably would not have been dated at all because of the potential problems. After some initial and prolonged troubles over many years, the bed was eventually dated successfully by careful sample preparation that eliminated the detrital minerals. Lubenow's work is fairly unique in characterising the normal scientific process of refining a difficult date as an arbitrary and inappropriate "game", and documenting the history of the process in some detail, as if such problems were typical. Another example is "John Woodmorappe's" paper on radiometric dating (1979), which adopts a "compilation" approach, and gives only superficial treatment to the individual dates. Among other problems documented in an FAQ by Steven Schimmrich, many of Woodmorappe's examples neglect the geological complexities that are expected to cause problems for some radiometrically-dated samples.
A good example
By contrast, the example presented here is a geologically simple situation -- it consists of several primary (i.e. not redeposited) volcanic ash deposits with a diverse dateable mineral assemblage (multiple minerals and methods are possible), found in fossil-bearing sedimentary rocks in western North America. It demonstrates how consistent radiometric data can be when the rocks are more suitable for dating. For most geological samples like this, radiometric dating "just works".
Color mine for empHASis. From this we see that the material in the KBS tuff is a mixture of older rocks with volcanic ash that has then been moved from it's original deposition site to the present location (erosion and deposition): this material is generally older than the deposit at the fossil site, some of it much older. The final radiometric date was found by eliminating these anachronistic elements from the samples used.
We also see that the dating was questioned from the start because of the known problems with this material.
There is a LOT more under the heading "A good example" that bears reading by anyone questioning radiometric dating. Far from being nearly impossible to find, samples that completely refute the AiG claim that:
quote:
The literature suggests that even if radiometric dating were valid in concept (which it is not), the practical matter of selecting rock samples that can be proved pure and uncontaminated requires an omniscience beyond humans.
Because it shows just such a case where the practical matter of selecting rock samples that can be shown to be pure enough and uncontaminated enough to produce valid dates is possible: that is all that is required, and it is what happens 999 times out of a thousand (compared to examples like the KBS tuff).
Another example of such a pure enough and contamination free enough samples is the Devil's Hole deposit, that shows a continuous record for over 500,000 years with two independent radiometic dating systems.
That second TalkOrigins article also addresses the common creatortionista claim of circular reasoning:
quote:
Circularity?
The unfortunate part of the natural process of refinement of time scales is the appearance of circularity if people do not look at the source of the data carefully enough. Most commonly, this is characterised by oversimplified statements like:
"The fossils date the rock, and the rock dates the fossils."
Even some geologists have stated this misconception (in slightly different words) in seemingly authoritative works (e.g., Rastall, 1956), so it is persistent, even if it is categorically wrong (refer to Harper (1980), p.246-247 for a thorough debunking, although it is a rather technical explanation).
When a geologist collects a rock sample for radiometric age dating, or collects a fossil, there are independent constraints on the relative and numerical age of the resulting data. Stratigraphic position is an obvious one, but there are many others. There is no way for a geologist to choose what numerical value a radiometric date will yield, or what position a fossil will be found at in a stratigraphic section. Every piece of data collected like this is an independent check of what has been previously studied. The data are determined by the rocks, not by preconceived notions about what will be found. Every time a rock is picked up it is a test of the predictions made by the current understanding of the geological time scale. The time scale is refined to reflect the relatively few and progressively smaller inconsistencies that are found. This is not circularity, it is the normal scientific process of refining one's understanding with new data. It happens in all sciences.
For potential critics: Refuting the conventional geological time scale is not an exercise in collecting examples of the worst samples possible. A critique of conventional geologic time scale should address the best and most consistent data available, and explain it with an alternative interpretation, because that is the data that actually matters to the current understanding of geologic time.
I suggest anyone interested in the validity of the AiG claim of circular reasoning read the whole section.
The original KBS Tuff dates (212 million to 230 million years of age) did not match the known stratigraphic age of the area.
The dates in contention -- from 1.6 to 2.6 million years -- show that the dates are problematic in some cases. This does NOT mean that the dates are problematic in ALL cases, NOR does it mean that the methods are invalid, because it does not demonstrate that these conditions apply to all samples.
In all cases the dates derived are still consistently older than any YEC model: even the worst date examples from radiometric methods show that the earth is older than a YEC model can explain.
Enjoy.
Edited by RAZD, : added last p to last quote

Join the effort to unravel AIDS/HIV, unfold Proteomes, fight Cancer,
compare Fiocruz Genome and fight Muscular Dystrophy with Team EvC! (click)


we are limited in our ability to understand
by our ability to understand
RebelAAmericanOZen[Deist
... to learn ... to think ... to live ... to laugh ...
to share.

This message is a reply to:
 Message 187 by Reserve, posted 04-05-2007 4:28 PM Reserve has not replied

RAZD
Member (Idle past 1435 days)
Posts: 20714
From: the other end of the sidewalk
Joined: 03-14-2004


Message 194 of 357 (393763)
04-06-2007 8:53 PM
Reply to: Message 191 by JonF
04-06-2007 10:39 AM


Re: It just keeps adding up -- the earth is OLD.
Thanks Jon.
Can you look up
F.J. Fitch and J.A. Miller, 'Radioisotopic Age Determinations of Lake Rudolf Artifact Site', Nature 226, April 18, 1970, p. 226.
And send me a PDF? This has the old 200myr dates and should say why they are bad at the start.

This message is a reply to:
 Message 191 by JonF, posted 04-06-2007 10:39 AM JonF has replied

Replies to this message:
 Message 197 by JonF, posted 04-07-2007 12:05 PM RAZD has replied
 Message 206 by JonF, posted 04-12-2007 12:35 PM RAZD has replied

RAZD
Member (Idle past 1435 days)
Posts: 20714
From: the other end of the sidewalk
Joined: 03-14-2004


Message 198 of 357 (393954)
04-08-2007 4:45 PM
Reply to: Message 197 by JonF
04-07-2007 12:05 PM


Re: It just keeps adding up -- the earth is OLD.
Thanks. I'll see what I can find.

This message is a reply to:
 Message 197 by JonF, posted 04-07-2007 12:05 PM JonF has not replied

RAZD
Member (Idle past 1435 days)
Posts: 20714
From: the other end of the sidewalk
Joined: 03-14-2004


Message 205 of 357 (394383)
04-10-2007 10:07 PM
Reply to: Message 200 by Reserve
04-10-2007 9:33 AM


Re: It just keeps adding up -- the earth is OLD.
And who decides when we have the complete understanding of the samples?
When the anomalies are explained by science based on observation, theory, prediction, test and validation. And by independent verification by replication of the results. That is how science works.
You are saying that all dates given by dating methods is due to a complete understanding, including history of the samples.
Not the samples per se, the history of the area and the sediments the samples came from: if there are reasons to think the dates are suspect due to those factors then you TEST that concept by looking for variations in the dates for different parts and see if you can reproduce such errors. They did that. Then you look for ways to eliminate the conflicts that cause the erroneous dates. They did that. Then you see if what you get is consistent between different samples tested in different ways with those conflicts eliminated. They did that. Then you look at the results. They did that: the dates agreed between the different methods once the causes of errors had been removed.
Do you really think the dates can be fudged to come out with whatever results one wants? If you do, then how do you explain all the dates that "just happen" to come out right the first time? Even on blind sample testing?
The dates were not conclusive based on a complete understanding, but on the best date that fit with the evolutionary theory. Thats it.
Nope. Else they would have stayed with Leakey's 2.6 million years eh?
Who is to say we will not find some more understanding on all the history of all the rocks? (e.g. the flood in Noah's day).
Well ... as soon as there is a testable theory for how this could actually work ... and how it would explain all the evidence from all the different sources for the age of the earth ... then all this amounts to is mere handwaving in desperation while denying that the evidence shows consistent dates for an old earth. Don't hold your breath however.
Let me reiterate -- the age of the earth by various non-radiometric methods, methods based on a number of different ways that annual sequences can be counted, ones that do not rely on radioactivity or rocket science to understand -- give these results:
  • Message 2 - The minimum age of the earth is 8,000 years by annual tree rings in California.
  • Message 3 - The minimum age of the earth is 10,434 years by annual tree rings in Europe (different environment, different genus, not just different species and from two different locations ).
  • Message 4 - The minimum age of the earth is 12,405 years by adding more annual tree rings in Europe (different environment and species), confirmed by carbon-14 levels in the samples (different information from the same sources).
  • Message 5 - The minimum age of the earth is 35,987 years by annual varve layers of diatoms in Japan (different process, biology and location).
  • Message 6 - The minimum age of the earth is 40,000 years by annual layers of ice in China (different process altogether).
  • Message 7 - The minimum age of the earth is 37,957 years by visually counting layers, 60,000 years by counting dust layers, 110,000 years by measuring electrical conductivity of layers, and up to 250,000 years by counting of layers below a discontinuity, all counting annual layers of ice in Greenland (different location).
  • Message 8 - The minimum age of the earth is 422,776 years by annual layers of ice in the Vostok Ice Core, extended to 740,000 years with the EPICA Ice Core with an estimated final depth age of 900,000 years. (different location again).
These systems do not rely on radiometric dating methods, but on annual layers. Each one invalidates the YEC concept. Each one correlates with the others.
You need to address ALL the information, not just isolated dating anomalies that even if they are correct STILL show that the earth is old.
Denial of contradictory evidence is not confronting the evidence, but avoiding it.
Enjoy.

Join the effort to unravel AIDS/HIV, unfold Proteomes, fight Cancer,
compare Fiocruz Genome and fight Muscular Dystrophy with Team EvC! (click)


we are limited in our ability to understand
by our ability to understand
RebelAAmericanOZen[Deist
... to learn ... to think ... to live ... to laugh ...
to share.

This message is a reply to:
 Message 200 by Reserve, posted 04-10-2007 9:33 AM Reserve has not replied

RAZD
Member (Idle past 1435 days)
Posts: 20714
From: the other end of the sidewalk
Joined: 03-14-2004


Message 207 of 357 (394711)
04-12-2007 8:30 PM
Reply to: Message 206 by JonF
04-12-2007 12:35 PM


Re: It just keeps adding up -- the earth is OLD.
Thanks. Gottum. Doesn't look like any great surprises so far.

This message is a reply to:
 Message 206 by JonF, posted 04-12-2007 12:35 PM JonF has not replied

Replies to this message:
 Message 208 by Nighttrain, posted 04-13-2007 5:32 AM RAZD has seen this message but not replied

RAZD
Member (Idle past 1435 days)
Posts: 20714
From: the other end of the sidewalk
Joined: 03-14-2004


Message 210 of 357 (428867)
10-17-2007 10:33 PM
Reply to: Message 209 by NosyNed
07-18-2007 1:15 AM


Re: Bump de bump bump grind
Interesting how the YECers can't debate when they can't find it on the web.
Or something they have been told by some creatortionista culling the gullibles.
Enjoy.

Join the effort to unravel AIDS/HIV, unfold Proteomes, fight Cancer,
compare Fiocruz Genome and fight Muscular Dystrophy with Team EvC! (click)


we are limited in our ability to understand
by our ability to understand
RebelAAmericanOZen[Deist
... to learn ... to think ... to live ... to laugh ...
to share.

This message is a reply to:
 Message 209 by NosyNed, posted 07-18-2007 1:15 AM NosyNed has not replied

RAZD
Member (Idle past 1435 days)
Posts: 20714
From: the other end of the sidewalk
Joined: 03-14-2004


Message 213 of 357 (430910)
10-28-2007 8:28 AM
Reply to: Message 211 by Elhardt
10-28-2007 1:39 AM


Re: It just keeps adding up -- the earth is OLD.
Welcome to the fray Elhardt,
Being extremely liberal and taking the maximum possible depth of ice at 2 miles thick and your first number, you end up with 40 years of annual ice per foot, or one year adding only about 0.3 inches. If it's 900,000 years as the post above states, it gets worse. You're now at about 0.15 inches added per year. The problem is that appears orders of magnitude too small and contradicts other things I've seen.
There are a couple of errors here, first is that the layers are not the same thickness now as when they were laid down. If you read the references you would see that the layers are compressed by the ice and snow over them, with the deeper layers being more compressed than the upper layers. Second, the thickness of the layers has nothing to do with their annual character - again the references give information on the differences between summer and winter ice that is irrespective of thickness.
For example, on one documentary I was watching, some scientists dug down about 6 feet into the ice, and they were pointing out that you could see the yearly layers as the sun shined through the ice, and it was about 9 inches per year. They also said the ice at that place was about 4000 feet deep. A simple calculation gives you an age of about 5333 years. So a problem may appear on your end, not on the YEC's end.
Again, a there are several errors here. First, you are still assuming constant layer thickness as noted above, and second the same references that tell you about the compression of the ice layers also talk about where the ice is so compressed that the annual layers can no longer be distinguished by eye, and have to be measured by other means (based on the characteristics of winter ice versus summer ice). Third, you are assuming that "a simple calculation" has some real relationship to reality when you have not established a basis for making such a claim: to do so honestly you would need to show first that the layers do not change in time. The scientists counting the layers are making no such assumptions -- they are content to count the layers.
Also take those P-38 aircraft that landed on the ice in Greenland in 1942. When some veterans went back to recover one, none of them could be found. They were under 268 feet of ice in just 50 years. Too often is seems things move a lot faster than scientists tell us.
As noted by kongstad ice build up is different in different places. This P-38 story is an old creationist PRATT (point refuted a thousand times) for several reasons. The most basic is that the depth of ice is not the same as annual layers of ice. By knowing the differences between winter and summer ice even the ice over the P-38 (and other craft) can still be separated into annual layers. Amazingly when this is done and the layers counted, they match the age of the aircraft.
Who says one band in an ice core equals one year anyway? Isn't it possible to have multiple falls of snow and melting and freezing in one year? And I am not aware that anybody has ever taken a two mile long or deep ice core either. So who knows what the yearly layers look like.
The fact that you have not read the references provided, nor studied the issue by researching the articles in the science journals is evident, so what you are aware of or not aware of seems to hold very little value. As noted above the references do not assume that "one band in an ice core equals one year" -- they test the ice to see that the bands are annual layers.
As you can see, in this annual ice layer case there are nothing but contradictions.
We see nothing of the kind, rather what we see is a rather ignorant (having skipped the references that give the information) review by an amateur who is unfamiliar with the behavior of ice. For instance:
First we need to solve contradictions like 9 inches per year vs 0.15 inches per year or we're going to get nowhere.
There is no contradiction, as this is actually discussed in the references, where they explain about the compaction of the ice and the relative thickness of the layers as they change with depth. You also fail to show that the 9" layers are from the same place as the ice cores.
And the snow on the antarctic is supposed to be slowly moving outward like a glacier and dropping into the ocean such that there shouldn't be any ice still existing from 400,000+ years ago.
When you compress any material vertically it tends to spread horizontally. The degree of spread depends on the compressibility of the material and whether there is anything to restrain the horizontal spread. Spreading horizontally does not make the material in the center disappear.
And there is evidence that rivers were depositing sediments into the ocean 6-7000 years ago there meaning it was partly free from ice.
Or that the rivers were running under the ice, as they do in many many many places covered by glaciers.
The whole picture gets very confused.
It looks to me like you need to do some real research into the subject, not read creationist "papoganda" and educate yourself about what the facts are about the ice layers. The information is available.
Enjoy.

Join the effort to unravel AIDS/HIV, unfold Proteomes, fight Cancer,
compare Fiocruz Genome and fight Muscular Dystrophy with Team EvC! (click)


we are limited in our ability to understand
by our ability to understand
RebelAAmericanOZen[Deist
... to learn ... to think ... to live ... to laugh ...
to share.

This message is a reply to:
 Message 211 by Elhardt, posted 10-28-2007 1:39 AM Elhardt has not replied

RAZD
Member (Idle past 1435 days)
Posts: 20714
From: the other end of the sidewalk
Joined: 03-14-2004


Message 221 of 357 (431083)
10-29-2007 7:47 AM
Reply to: Message 220 by johnfolton
10-29-2007 1:28 AM


Re: Siberia's Massive Peat deposits all C-14 dating young!
Just a quick question for now (I'll get into your posts more tonight):
What does this have to do with the correlations of ages between the different systems?
It is one thing to say:
Message 216
Either the C-14 dating is bogus and the siberian peat not young or the Greenland ice varve dating is bogus and Greenland's young and not old.
And it is another to explain how the ages then are correlated by those different systems.
To say nothing of the fact there are other alternatives ...
Enjoy.

Join the effort to unravel AIDS/HIV, unfold Proteomes, fight Cancer,
compare Fiocruz Genome and fight Muscular Dystrophy with Team EvC! (click)


we are limited in our ability to understand
by our ability to understand
RebelAAmericanOZen[Deist
... to learn ... to think ... to live ... to laugh ...
to share.

This message is a reply to:
 Message 220 by johnfolton, posted 10-29-2007 1:28 AM johnfolton has not replied

RAZD
Member (Idle past 1435 days)
Posts: 20714
From: the other end of the sidewalk
Joined: 03-14-2004


Message 226 of 357 (431190)
10-29-2007 6:34 PM
Reply to: Message 216 by johnfolton
10-28-2007 7:30 PM


Re: Siberia's Massive Irrelevance to GISP2
Siberia is one of the coldest areas in the northern hemisphere but it has evidence in its permafrost called peat.
Yet the area you are talking about is a coastal environment near sea level at 66.5°N to 70°N (and 67°E to 72°E), while the Greenland GISP2 core was taken from 72.6°N, 38.5°W, 3200 meters (~10,500 feet, nearly 2 miles) above sea level:
http://www.agu.org/revgeophys/mayews01/node2.html
quote:
On 1 July 1993 the Greenland Ice Sheet Project Two (GISP2) successfully completed drilling through the base of the Greenland Ice Sheet and another 1.55 m into bedrock at a site in the Summit region of central Greenland (72.6N; 38.5W; 3200 masl) [Mayewski et al., 1994a].
In addition the climate NOW at your Siberia sites (taking the northermost one for example):
quote:
Climatically, the Seyaha region corresponds to the Arctic zone. The climate today is continental with a mean annual temperature of -9.8°C, mean winter temperature -16.4°C, mean January temperature -22.9°C, mean summer temperature +5.6°C, and mean July temperature +7.2°C. The winter (with mean day temperatures below 0°C) duration is 255 days and summer (with mean day temperatures above 0°C) lasts for 110 days. Tundra vegetation dominates the area, with low shrubs such as dwarf birch and willow occurring in river valleys only.
Is significantly different from the climate NOW at the GISP2 core site:
quote:
The Summit region has proven to be an ideal site from which to recover deep ice cores. The ~-31°C mean annual air temperature at Summit and minimal occurrence of melt layers throughout the record assure the in-situ preservation of a broad range of gaseous, soluble and insoluble measures of the paleoenvironment. The ~-9°C ice temperature measured at the base of the two cores (W. Hancock and M. Wumkes, personal communication, 1993; N. Gundestrup and L. Hansen, personal communication, 1993) assures that the ice sheet in this region is frozen to its bed.
No permafrost there, to say nothing about forests at any time while the rock is covered by ice.
Siberia is located in the upper hemisphere like Iceland and Greenland but because of the prevailing winds does not get excessive moisture as does Greenland or Iceland.
Deserts don't get much precipitation either, but that doesn't mean that the environment is the same, a position that is demonstrably false by comparing their environments and ecosystems today.
Yet massive amounts of Peat in Siberia all needing thousands of years to form in a temperate climate are all dating only thousands of years old.
So? Your article talks about periods that had faster peat growth, but that still is not related to the Greenland ice core area or the change in climate there.
Given the evidence is that Siberia had a temperate continental climate only thousands of years ago then Greenland was green and the ice varves only thousands of years old.
Logically false. The climate in Siberia back in the Holocene Optimum is only ~2.5°C warmer, estimated from the effect of global warming in your article:
quote:
The climate in the Shchuch’ya River valley region is also continental, with a mean annual temperature of -7.5°C, mean winter temperature -16.1°C, mean January temperature -24.0°C, mean summer temperature +8.4°C, and mean July temperature +13.2°C. The winter duration is 236 days, and summer lasts for 129 days. The region is also dominated by tundra vegetation, but trees such as birch and larch grow in the valleys of large rivers.
The peat near Labytnangi town is interesting because it simulates the Holocene Optimum thawing near the southern limit of the permafrost area. Thirty years ago, it was frozen (the ground temperature below -2 oC), but during the last 10-15 years the peat thawed very quickly due to global warm ing. In this area climate is also continental, with mean annual temperature of -7.0°C, mean winter temperature -15.3°C, mean January temperature -23.6°C, mean summer temperature +8,9°C, and mean July temperature +13.8°C. The winter duration is 229 days, and summer duration is 136 days.
{abe}Note +13.8°C = 57°F{/abe}
And applying twice this difference to Greenland at the site of the cores still means an mean annual air temperature at Summit ~-26°C -- STILL significantly different from your sites in Siberia. Thus it would take an order of magnitude more warming to turn the Greenland GISP2 site into Siberia.
Borisov argued that this idea is not all that far-fetched. He notes that measurements carried out on Greenland’s northeastern glaciers as far back as the early 1950’s showed that they were loosing ice far faster than it was being formed. 8 The northeastern glaciers were in fact in “ablation” as a result of just a 1C rise in average global temperature. What would be expected from another 2C rise? - over the course of several thousand years?
In other words, global warming is not new, and you are talking about the coastal ice fields and not the glacier where the ice cores were taken.
Message 220
Given the Yamal Peninsula was not frozen over with trees known to be growing that far north for thousands of years. Meaning a climate far different may have existed where the summer and winter climatic models that have been assumed are being re-evaluated.
Or one just enough different that the trees growing in the river valleys would survive on the hillsides. A change far less extreme than the difference between the climate in Siberia and the one at the GISP2 ice core location.
With only a 1 degree rise in global temperature today you need a paddle boat near the north pole. Imagine what a 2 degree rise in global temperature would do in respect to opening up the Artic Ocean to the ocean tidal currents.
In the summer of 2006. Previous explorers have encountered open water at the pole before this, and this still is not the GISP2 site climate\environment.
Its highly possible that the Artic Ocean was open 5,500 years ago and that these indicator fossils ...
What "indicator fossils"? Which paper? Please try to be a little more coherant?
... are only 5,500-9,500 years old.
So?
In the same part of the link as the Berezovka Mammoth it talks of temperate plants and warm weather animals all jumbled together within the Artic Circle along the same latitude as Greenland all around the globe.
No real evidence the ice varves in Greenland could of existed with all these warm blooded creatures and temperate plant thriving for thousands of years 5,500 years ago.
There are many warm-blooded creatures living within the Arctic Circle today, dogs for instance, so this means little. From your sited "Ancient Ice" article:
quote:
The well preserved "mummified" remains of many mammoths have been found along with those of many other types of warmer weather animals such as the horse, lion, tiger, leopard, bear, antelope, camel, reindeer, giant beaver, musk sheep, musk ox, donkey, ibex, badger, fox, wolverine, voles, squirrels, bison, rabbit and lynx as well as a host of temperate plants are still being found all jumbled together within the Artic Circle - along the same latitudes as Greenland all around the globe.39
Reference 39 is an AnswersInGenesis article by Michael J. Oard:
quote:
Michael J. Oard has an M.S. in atmospheric science from the University of Washington and works as a meteorologist with the US National Weather Service in Montana. He is the author of the monographs An Ice Age Caused by the Genesis Flood and Ancient Ice Ages or Gigantic Submarine Landslides? He serves on the board of the Creation Research Society.
A weatherman? Writing (supposedly) about paleontology?
I also see no relevance of this information to either the environment of the Yamal Penninsula OR the GISP2 site in Greenland -- those fossils could be from anywhere, given the detail of data in the articles, nor do we have information on the age of each fossil. It looks to me like a typical creationist article that tries to provide massive misinformation in a pseudo-scientific manner while providing no real information and no way to validate the information.
Given that AiG publishes documented falsehoods on a regular basis it is not a reliable site for anything, and thus neither is any article that uses it for a reference. Relying on them puts you in a position of passing on falsehoods through ignorance of the facts. For instance:
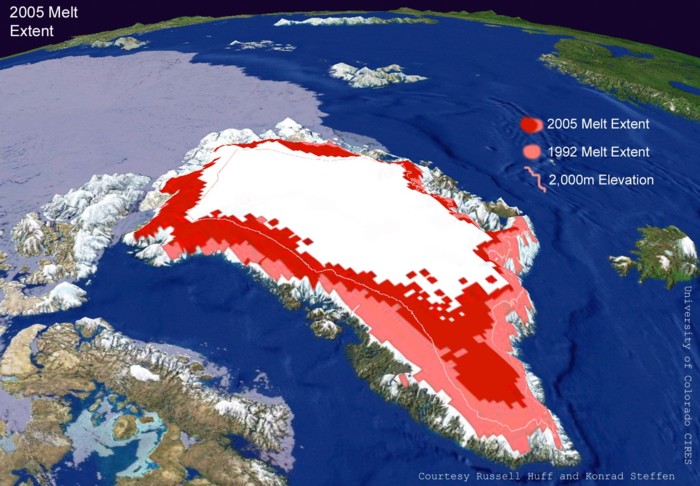
Message 216
The Greenland Ice varves are melting today and the average global temperature its been said to have "only" raisen 1 degree celcius over the last 100 years.
Compare that statement to this picture (with strangely no discussion) from the "Ancient Ice" article:
quote:

Doing a little research I found the reference:
Maximum Melt Extent on Greenland Ice Sheet, 2005
quote:
Passive microwave satellite data are used to map snowmelt extent and duration on the Greenland ice sheet. The total melt extent of the ice sheet, experiencing at least 1 melt day between April 1 - September 25 shows a record extent in 2005 for the 27-year long time PM data set. The 2005 melt extent exceeds the previous record of 2002. (Steffen et al., 2004; Hanna et al., 2005)
There was extensive melt for 7 days during 2005 that covered ALL of southern Greenland including South Dome at an elevation of 2900 m for 3 days. This event resulted in the largest melt area recorded on the ice sheet surpassing the previous record in 2002. The 3-D view of Greenland melt extent shows the total melt area for 2005 and highlights the regions that never melted in the previous 26-year long PM record.
The melt extent for 1992 (minimum extent) and for 2005 (maximum extent) are displayed in the same 3-D view of Greenland in light red (1992) and dark red (2005) color.
In other words, the area that is white did not have 1 day of melt in all of 2002, 2005 or the last 26 years in the record, and that is also where GISP2 is located. (See http://www.lib.utexas.edu/...ands_oceans_poles/greenland.jpg about where the vertical longitude crosses the solid latitude line ... you want 72.6°N, 38.5°W).
Melting in Greenland does not mean melting of the ice layers at the GISP2 location.

Summary

The environment at GISP2 is significantly different from the Siberian Yamal Penninsula and there is no real basis for saying that evidence from the Holocene Optimum at one site compares to conditions at the other.
The further spread (dilution?) of information to vague and general conditions anywhere within the Arctic Circle (starting at ~66.5°N) and jumbling in fossils from any number of sites does not increase the evidence that things were significantly different enough at GISP2 to turn it into an environment anything like the Yamal Penninsula. This is much more like misdirection than evidence -- the kind of misdirection used by magicians during staged tricks.
There has not been significant melt recorded at the GISP2 site, nor has there been any other evidence presented that suggests that the layers of ice at GISP2 are not annual layers that add up to an age of 110,000 years for the ice, and at least that time for the existence of the earth.
There is not one (1) thing in any post of yours so far that addresses the issue of correlations between dating methods. Without addressing those correlations all your innuendos are just pie in the sky concepts, typical of creationists.
Thus your posts have not been relevant to the actual conditions at GISP2, whether now or in the past, nor to the issue of correlations between dating methods, the actual topic of this thread.
Enjoy.
Edited by RAZD, : abe

Join the effort to unravel AIDS/HIV, unfold Proteomes, fight Cancer,
compare Fiocruz Genome and fight Muscular Dystrophy with Team EvC! (click)


we are limited in our ability to understand
by our ability to understand
RebelAAmericanOZen[Deist
... to learn ... to think ... to live ... to laugh ...
to share.

This message is a reply to:
 Message 216 by johnfolton, posted 10-28-2007 7:30 PM johnfolton has replied

Replies to this message:
 Message 227 by johnfolton, posted 10-29-2007 9:09 PM RAZD has replied

RAZD
Member (Idle past 1435 days)
Posts: 20714
From: the other end of the sidewalk
Joined: 03-14-2004


Message 228 of 357 (431266)
10-30-2007 8:14 AM
Reply to: Message 227 by johnfolton
10-29-2007 9:09 PM


Re: Siberia's Massive Irrelevance (still) to GISP2
I don't see how Ice Varves could of existed however will let you get back to your topic. I've got things happening just trying to raise within your mind a question of doubt about the truthfullness of ice varves even existing 5,500 years ago.
First off the world of reality is not affected by what you see and understand. The fact remains that you do not provide any explanation for the correlations once you throw out the concept of the ice layers being only 5,500 years: your explanation of the facts is incomplete at best, fallacious at worst. Science on the other hand explains both the age they get and the correlations.
It does not sound like the land itself is 2 miles above sea level just the ice. Do you have any evidence the lands elevation is any different than the Yamal Peninsula.
Well you could take the difference between the elevation and the core length, the data is there. Of course you would want to compare the difference in elevation at the time of the Yamal Penninsula thaw during the Holocene Optimum -- say 9,000 years ago, which is pretty near the top of the column of ice. Otherwise you are comparing one place at one time and another at another time.
These organisms are indicator fossils ...
You still have not explained what "indicator fossils" you are talking about: to be scientific about this you need to list the species identifications with locations and climate where they were found ... "somewhere" in the Arctic Circle is rather inadequate at best, and an outright falsehood at worst in terms of talking about conditions either at the Yamal Penninsula or at the GISP2 site in Greenland (where no fossils have been found).
Purdue University talking about tropical organism's thriving at around 73 degrees Fahrenheit basically beneath the north pole.
I thought the North Pole was over water (and thus necessarily at sea level). And this too is irrelevant when talking about the climate at GISP2. Just as irrelevant as the climate at Yamal Penninsula, because it is significantly different today.
If the earth was old the Russians study should of had tree's/Peat dating 50,000+ years. They didn't their evidence does not support an old earth.
False, totally false. Not just because the logic is false, but because there can be any number of reasons for no peat before 9,000 BP -- one of which is that the area was covered by ice.
The problem with evolutionists they always basing the past by the present.
This too is a falsehood. Science is based on the assumption that the evidence is true, that the evidence tells you what happened. What we see by applying this is that at several times in the past that climate and conditions were different than they are at the present -- note how thoroughly this falsifies your claim.
P.S. In an artic tropical like climate would think rainfall would be the result not snow much like we see in Seattle Washington.
First, temperatures up to 73°F is not tropical, and second, once again, what you think is irrelevant to what the evidence shows. Third, right there in Seattle you can look out and see mountains covered in snow and ice year round, mountains with heights similar to the GISP2 site.
Note you have not refuted a single point I have made regarding the difference in climate at GISP2 down to and including the lack of evidence of melting at the site.
The reality is that you have no argument. You can't (or won't attempt to) explain the correlation in dating methods, and you can't refute existing methods with irrelevant information.
Enjoy.
Edited by RAZD, : corrected subtitle
Edited by RAZD, : grammar

Join the effort to unravel AIDS/HIV, unfold Proteomes, fight Cancer,
compare Fiocruz Genome and fight Muscular Dystrophy with Team EvC! (click)


we are limited in our ability to understand
by our ability to understand
RebelAAmericanOZen[Deist
... to learn ... to think ... to live ... to laugh ...
to share.

This message is a reply to:
 Message 227 by johnfolton, posted 10-29-2007 9:09 PM johnfolton has not replied

RAZD
Member (Idle past 1435 days)
Posts: 20714
From: the other end of the sidewalk
Joined: 03-14-2004


Message 230 of 357 (436863)
11-27-2007 8:55 PM
Reply to: Message 229 by SophistiCat
11-27-2007 7:00 PM


Re: John Baumgardner on C14
Thanks, and welcome to the fray, SophistiCat.
I don't have the time or energy to debate on other forums.
A better thread to put this information is Radioactive carbon dating. The rest of my response is there at Message 151, with one point I'd like to repeat here:
quote:
The problem for these people is that even if such "contamination" of samples is common in the world of archaeological samples that do come from sources that obtained their C12 and C14 from atmospheric carbon, that the level of error produced is still within the margin of error for the dating methods, and radioactivity can be eliminated in most cases relatively easily. Take the Lake Suigetsu clay\diatom varves, with some 35,000 annual layers and samples of organic debris found in the layers: because of the manner of formation of the varves there is no source of radioactivity that could change the age of those samples, and the varve layer age would still correlate with the radiocarbon date properly.
The correlations still demonstrate that a YEC world is not possible.
Enjoy.

Join the effort to unravel AIDS/HIV, unfold Proteomes, fight Cancer,
compare Fiocruz Genome and fight Muscular Dystrophy with Team EvC! (click)


we are limited in our ability to understand
by our ability to understand
RebelAAmericanOZen[Deist
... to learn ... to think ... to live ... to laugh ...
to share.

This message is a reply to:
 Message 229 by SophistiCat, posted 11-27-2007 7:00 PM SophistiCat has not replied

Replies to this message:
 Message 231 by johnfolton, posted 11-28-2007 5:17 AM RAZD has replied

RAZD
Member (Idle past 1435 days)
Posts: 20714
From: the other end of the sidewalk
Joined: 03-14-2004


Message 233 of 357 (436939)
11-28-2007 7:49 AM
Reply to: Message 231 by johnfolton
11-28-2007 5:17 AM


another false lead
The greater age with increasing depth is explained by the C14 diffusing upward by CO2 & Methane anaerobic gasing.
This has already been covered on Carbon 14 Dating and the possible effect of "leaching", conclusion: no apparent leaching of C14 compared to C12 has occurred in Lake Suigetsu.
This still does not explain the correlation between C14 ages, the varve layers and the climate patterns in ice caps and Lake Suigetsu, nor the matching data in the overlap period with the tree rings.
Until you can explain the correlations between dating methods, speculation about possible theoretical problems with one dating method does not amount to a hill of beans -- the possible theoretical part is invalidated by the correlations.
Got that yet?
{abe}
... C14 can and does migrate due to anaerobic digestion and humic acids ...
And the leaf samples would not exist if there had been digestion of any kind.
Humic substance - Wikipedia
quote:
Humic acid is one of the major components of humic substances which are dark brown and major constituents of soil organic matter humus that contributes to soil chemical and physical quality and are also precursors of some fossil fuels.
Humic substances arise by the microbial degradation of plant and animal tissues and ultimately biomolecules (lipids, proteins, carbohydrates, lignin) dispersed in the environment after the death of living cells.
Again, this would mean that there would be no leaf sample left.
No need to rediscuss this for it was discussed to death on ...
Several threads and in no case did reversespin\charley\golfer\whatever make a point that was valid.
========================================================
14C is present in gaseous form (CO2) and gradually diffuses in the earth system.(from Razd own study they acknowledge C02 diffuses and 14C is present in gaseous form (C02)).
http://www.cio.phys.rug.nl/HTML-docs/Verslag/97/PE-04.htm
That link no longer works, but this still doesn't explain how C14 gets from your gas -- IF it exists -- into the organic samples and replaces the carbon in the molecules. Without a mechanism to exchange the carbon this is again just your wishful thinking and not a real explanation. This has been pointed out before so repeating it is just evidence that reversespin\charley\golfer\whatever is ignoring evidence that contradicts him.
Liquefaction occurs in saturated soils, that is, soils in which the space between individual particles is completely filled with water. This water exerts a pressure on the soil particles that influences how tightly the particles themselves are pressed together.
Which does not apply to sediment already at the bottom of a lake.
Doesn't mention carbon-14 anywhere nor discuss preferential leaching of isotope specific carbon.
When microorganisms die in ponds of water or in the ocean, they slowly sink to the bottom, forming a thick black sludge. Over time, this sludge becomes buried and compacted by more organisms and layers of mud. If oxygen is left out of the mixture, the organic matter can’t decay and it eventually fossilizes into the material called kerogen.
This doesn't apply to the leaf samples buried in the Lake Suigetsu varves, and this Kerogen is absent from the Lake Suigetsu varves, more evidence that this doesn't apply here.
As is typical of reversespin\charley\golfer\whatever, this is a lot of irrelevant information that does not apply to the situation, and doesn't affect the carbon content or ratio in the samples of organic matter from Lake Suigetsu.
Lack of understanding, of the articles and of the data from the Lake, contributes to this false perception (or is it intentional misrepresentation?) by reversespin\charley\golfer\whatever. This has happened before. Frequently. But don't take my word for it -- read the thread he listed:
http://< !--UB EvC Forum: Dating from the Adams and Eves Threads -->http://EvC Forum: Dating from the Adams and Eves Threads -->EvC Forum: Dating from the Adams and Eves Threads< !--UE-->
Enjoy.
Edited by RAZD, : tangents
Edited by RAZD, : added last link

Join the effort to unravel AIDS/HIV, unfold Proteomes, fight Cancer,
compare Fiocruz Genome and fight Muscular Dystrophy with Team EvC! (click)


we are limited in our ability to understand
by our ability to understand
RebelAAmericanOZen[Deist
... to learn ... to think ... to live ... to laugh ...
to share.

This message is a reply to:
 Message 231 by johnfolton, posted 11-28-2007 5:17 AM johnfolton has replied

Replies to this message:
 Message 234 by johnfolton, posted 11-28-2007 9:34 PM RAZD has replied

RAZD
Member (Idle past 1435 days)
Posts: 20714
From: the other end of the sidewalk
Joined: 03-14-2004


Message 235 of 357 (437143)
11-28-2007 11:07 PM
Reply to: Message 234 by johnfolton
11-28-2007 9:34 PM


Re: Its a Young Earth Folks !!!!!!
This is a direct quote from the suigetsu Lake study on one of your links.
Provide the source so we can see how your have misrepresented it (note prediction). You are remembering one of your irrelevant links, I'll bet.
Anyone familar with biological science knows the absense of oxygen causes anaerobic digestion ...
Only IF there are anaerobic bacteria present where the object is. In the absence of anaerobic bacteria nothing happens.
Now we look at the evidence -- do we see leaves digested in unidentifiable mulch (humus) or do we see identifiable leaves thousands of years old?
Conclusion: no anaerobic bacteria are present around the leaf.
See how simple that is? See how it uses evidence from the Lake?
Enjoy.

Join the effort to unravel AIDS/HIV, unfold Proteomes, fight Cancer,
compare Fiocruz Genome and fight Muscular Dystrophy with Team EvC! (click)


we are limited in our ability to understand
by our ability to understand
RebelAAmericanOZen[Deist
... to learn ... to think ... to live ... to laugh ...
to share.

This message is a reply to:
 Message 234 by johnfolton, posted 11-28-2007 9:34 PM johnfolton has replied

Replies to this message:
 Message 236 by johnfolton, posted 11-29-2007 12:27 AM RAZD has seen this message but not replied

Newer Topic | Older Topic
Jump to:


Copyright 2001-2023 by EvC Forum, All Rights Reserved

™ Version 4.2
Innovative software from Qwixotic © 2024